
|
Fig. S2
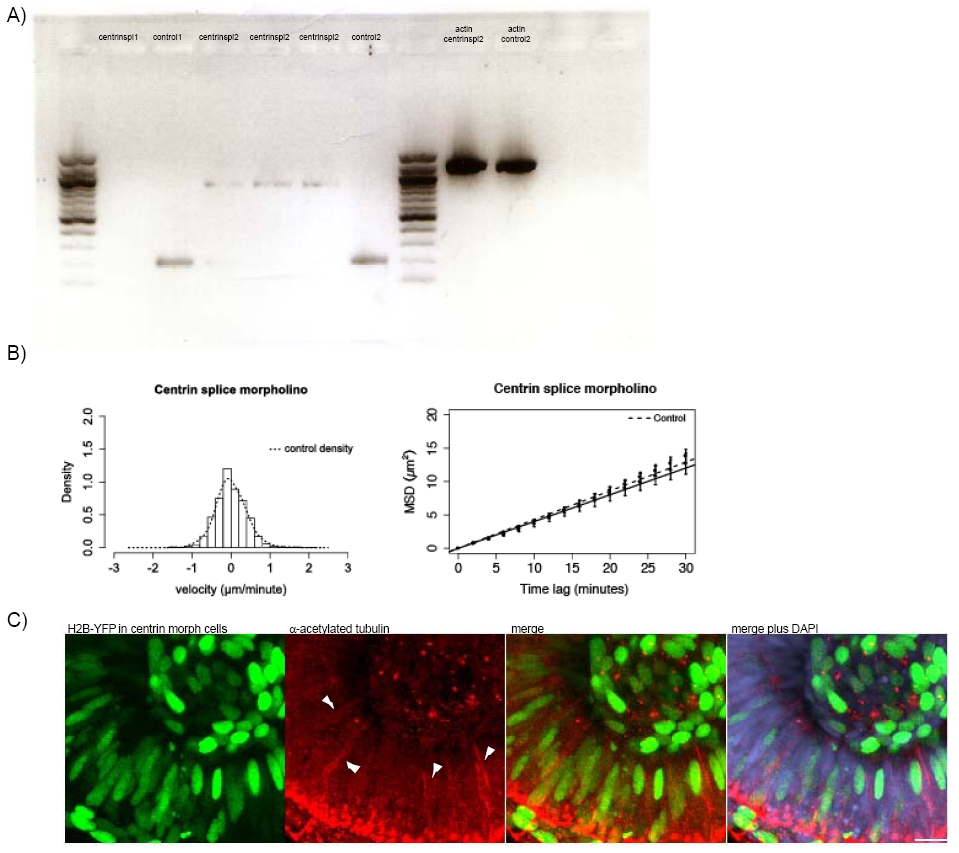
A) RNA was extracted from embryos using a Quiagen RNeasy Minikit and transcribed into DNA using the Quiagen One Step RT-PCR-kit.
Centrin DNA primers used:
F CGCTGATATTGATAAAGAAGGATCGGGC
R CATCCGTCAGGTTCTCTCCGAGC
Control embryos give a 200 bp band whereas incorporation of the intron in the splicing morphant gives a 900 bp band. As no 200bp band can be observed any more in the splicing morphant we conclude that the knockdown of centrin2 is nearly complete.
Beta actin DNA primers, that result in a 1200 bp product are used as control:
F GATGCCCCTCGTGCTGTTTTC
R ACCTCCCTTTCCAGTTTCCGC
B) Stochastic motion velocity distributions for centrin splice morphants and stochastic motion MSD profiles with linear fit for centrin splice morphants
C) Embryos were co-injected with H2B-YFP-RNA and 2.5ng Centrin2 translational morpholino at the 64 cell stage. Only cells expressing H2B-YFP are centrin morphants. Antibody staining for stable (acetylated) tubulin (red) was carried out to observe if cells that do not carry the morpholino still form stable microtubules that span the whole length of the cell. DAPI (blue) counterstaining shows cells not expressing H2B-YFP.
Reprinted from Cell, 138(6), Norden, C., Young, S., Link, B.A., and Harris, W.A., Actomyosin is the main driver of interkinetic nuclear migration in the retina, 1195-1208, Copyright (2009) with permission from Elsevier. Full text @ Cell