
|
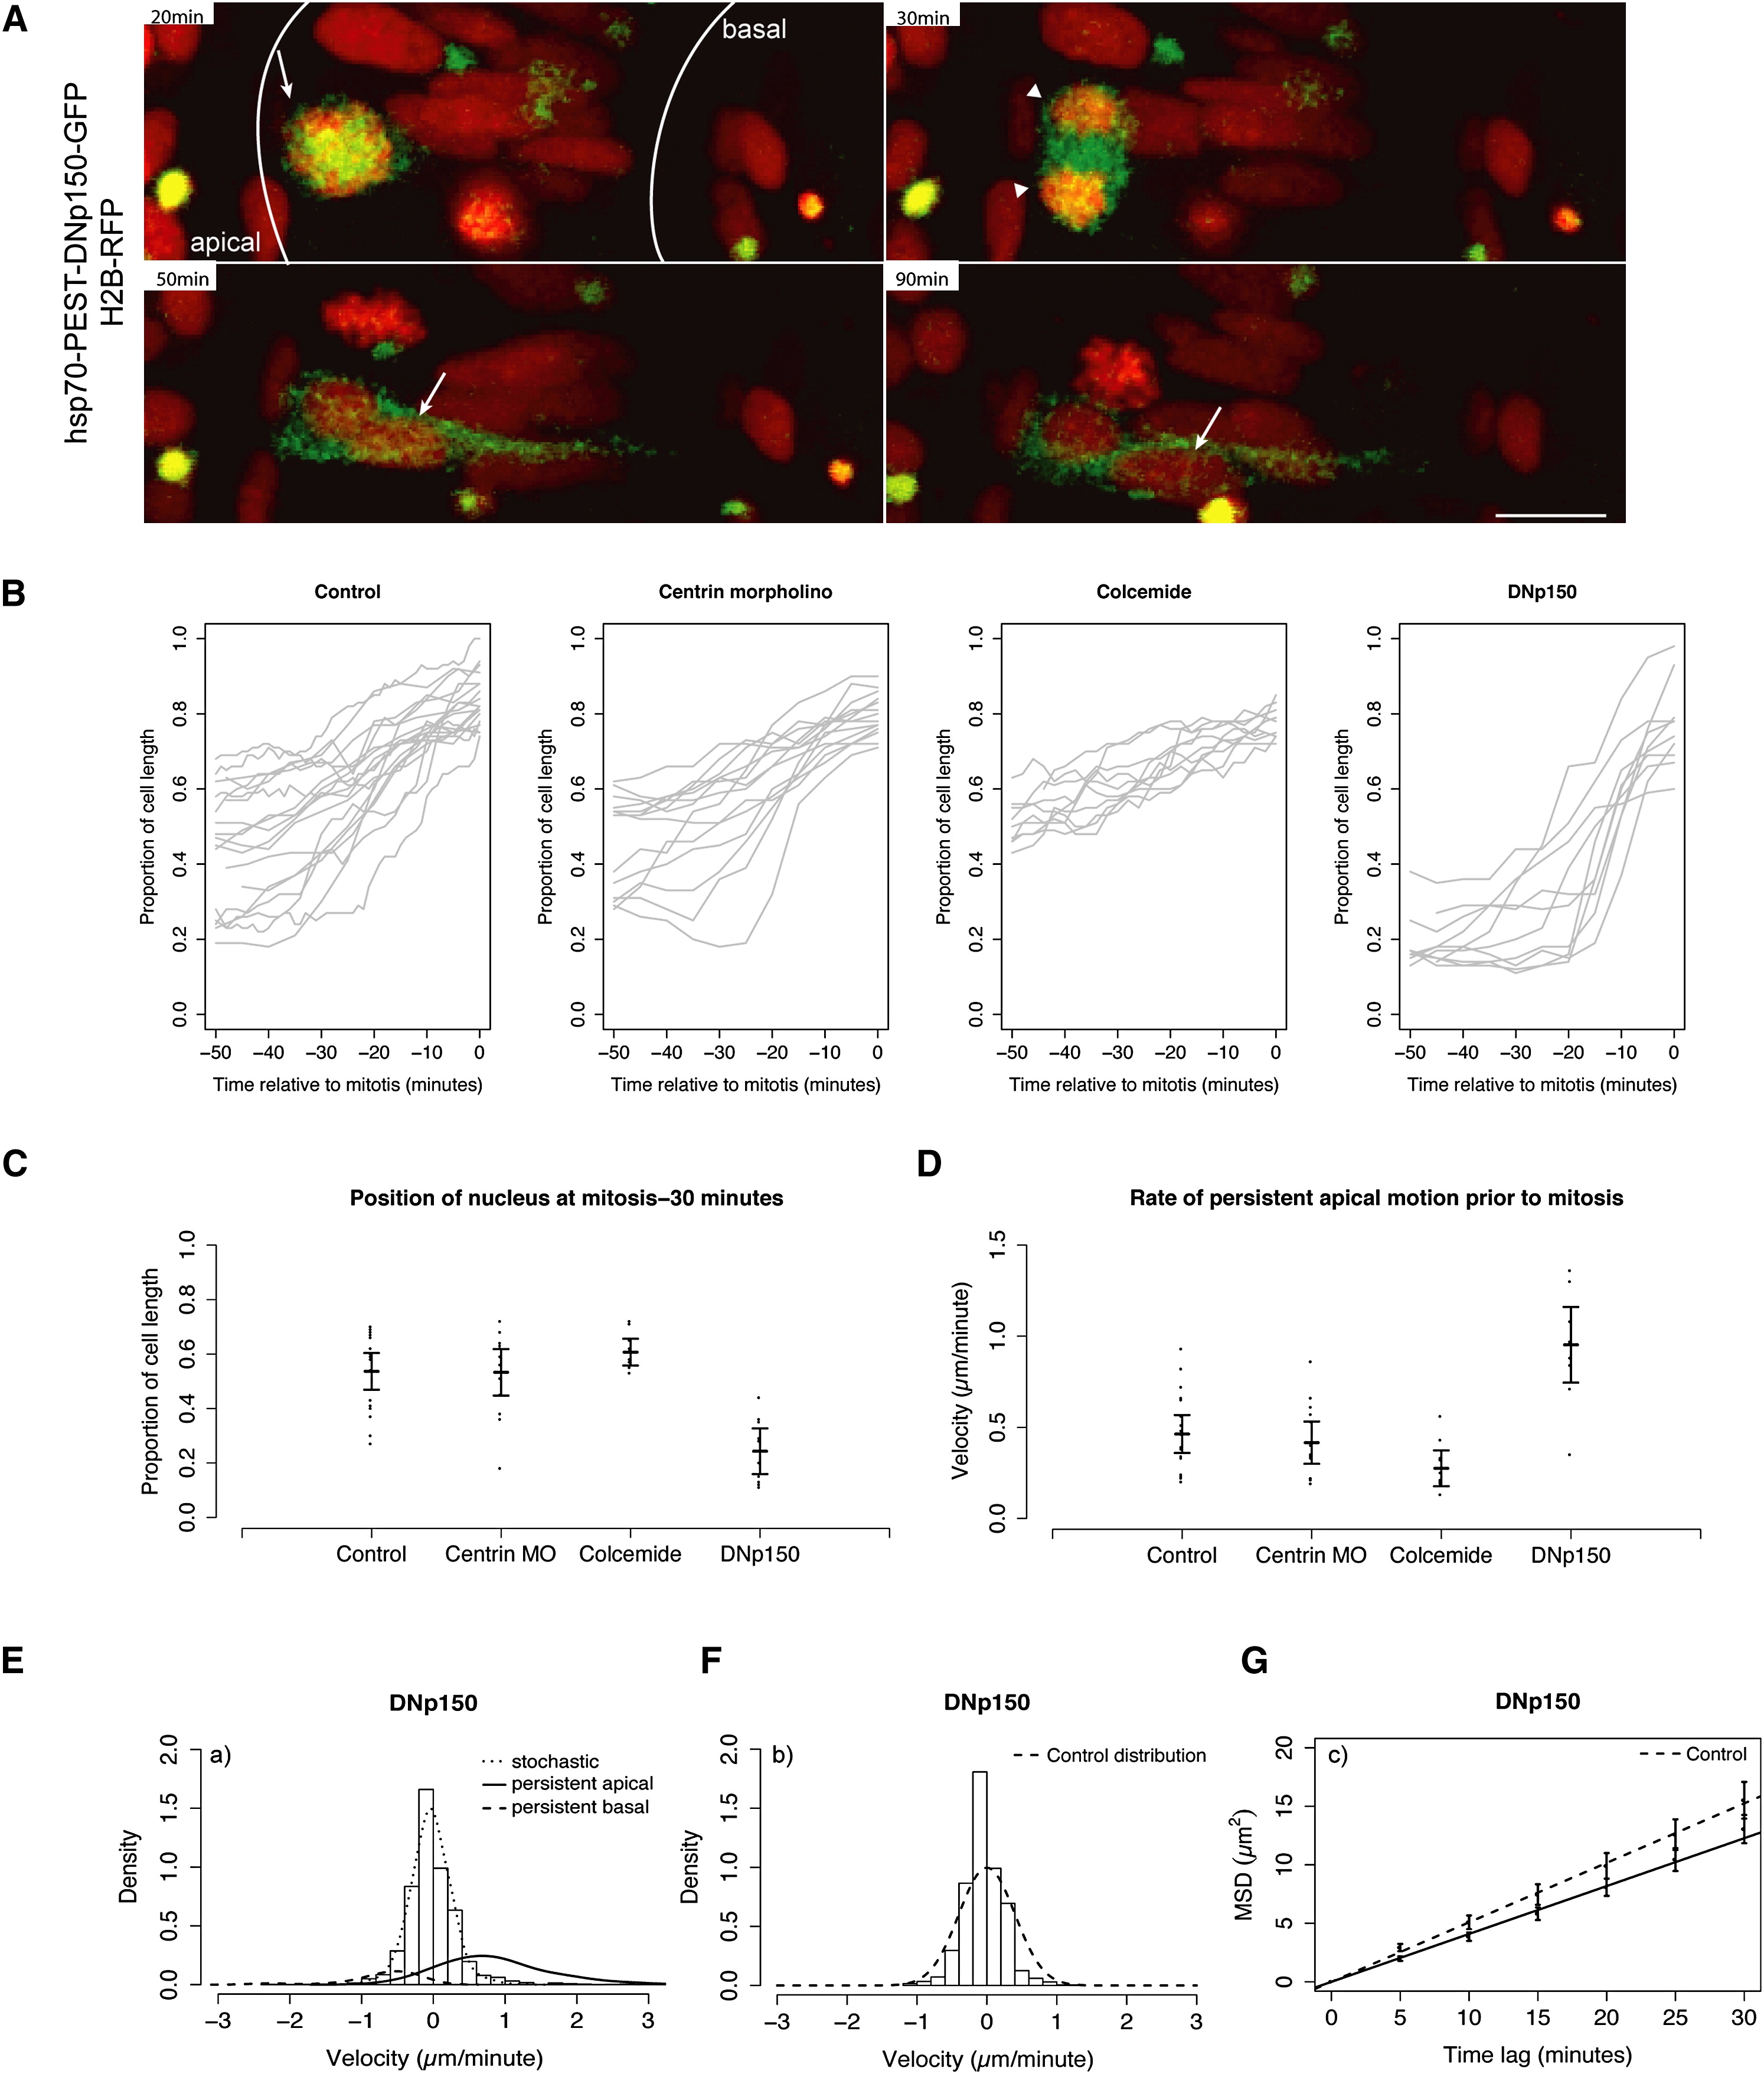
Fig. 3 Stochastic and Directed IKNM Movements Occur in Dynein/Dynactin-Compromised Neuroepithelial Cells
(A) H2B-RFP marked nuclei of hsp70-PEST-DNp150-GFP-expressing cells migrate to the apical pole (arrows), exhibit successful mitosis and cytokinesis (arrowheads), and then migrate basally (arrows).
(B) Raw nuclear trajectories showing nuclear migration during the 50 min preceding formation of a metaphase plate.
(C) Nuclear positions 30 min before formation of a metaphase plate. Each dot represents one nucleus. Error bars show the mean and 95% confidence intervals.
(D) Premitotic (-30 to 0 min before formation of metaphase plate) velocity estimates. Each dot represents velocity of one nucleus. Error bars show the mean and 95% confidence intervals.
(E) Velocity distribution of nuclear movements in DNp150-expressing cells (curves show nonparametric density estimates scaled in proportion to the number of nuclear displacements representing the motion type; persistent motion curves are enlarged by a factor of ten).
(F) Stochastic motion velocity distribution for nuclear movement in DNp150-expressing cells.
(G) Stochastic motion MSD profile with linear fit (error bars show 95% confidence intervals) for nuclear movement in DNp150-expressing cells.
Scale bars represent 10 μm.
Reprinted from Cell, 138(6), Norden, C., Young, S., Link, B.A., and Harris, W.A., Actomyosin is the main driver of interkinetic nuclear migration in the retina, 1195-1208, Copyright (2009) with permission from Elsevier. Full text @ Cell