
|
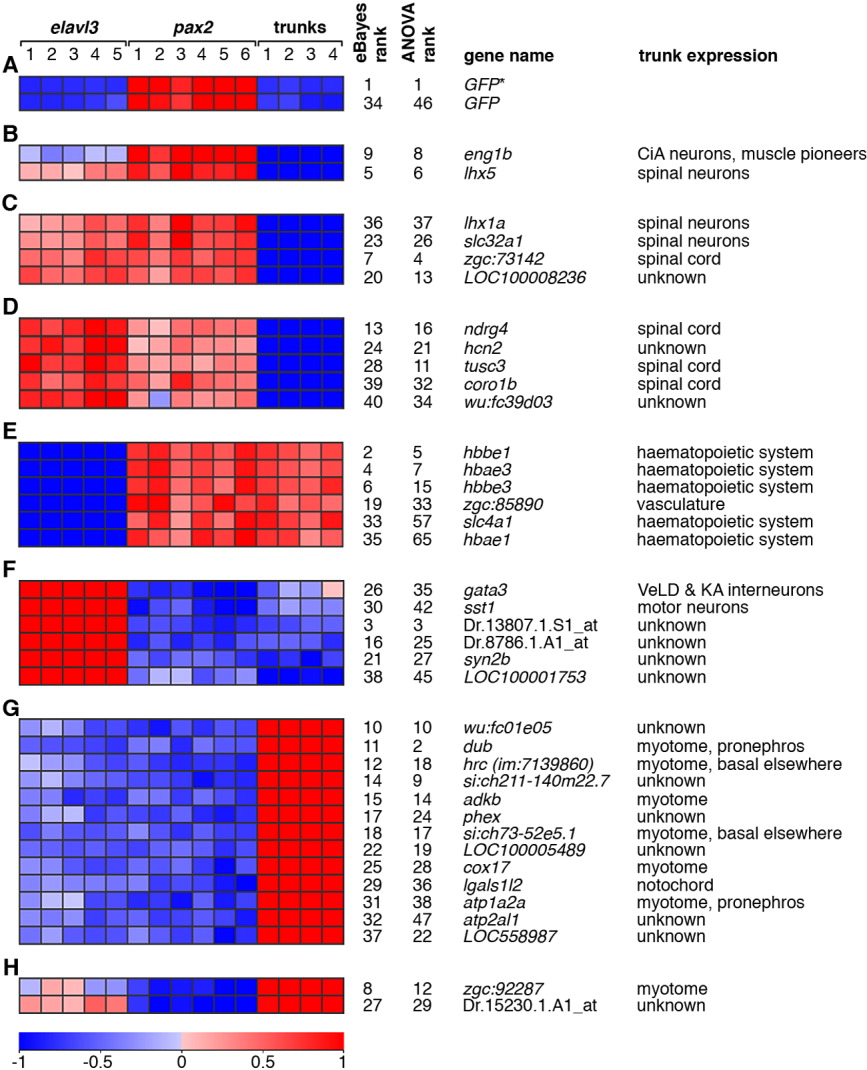
Fig. 3 Expression profiles of highly ranked, differentially expressed transcripts. The relative expression profiles of the top 40 probe sets ranked by an eBayes-based test for differential expression are shown. Relative Expression profiles and experimental groups are depicted as in Figure 2 and, again, expression profiles are shown as normalised expression data transformed to a mean of zero and standard deviation of +1 (red) to -1 (blue). The following is shown for each probe set: the ranks in eBayes-based and ANOVA tests for differential expression; the corresponding gene name and known expression in the trunk region of interest (see main text for references). The probe sets are divided into eight subsets (A-H) based on relative expression between experimental groups and statistical evidence for differential expression between groups. For statistics for each comparison, see Supp. Table 1. This is also discussed in more detail in the Results section. Those probe sets without an associated gene name are labelled with the Affymetrix probe set identifier. The probe set labelled as GFP* (AFFX-Dr-AF292560-1_s_at) was originally designed against the cyan fluorescent protein (CFP) gene; however, the probes in this set have complete sequence identity with GFP and would hybridise to GFP transcripts, but not EGFP transcripts in this experimental context. The probe set labelled wu:fc39d03 (Dr.5151.1.A1_at) is called ptprn2l in the current version of the Affymetrix annotation of probe sets for the zebrafish GeneChip. However, the original target sequence of the probe set is not currently associated with a UniGene identifier.