
|
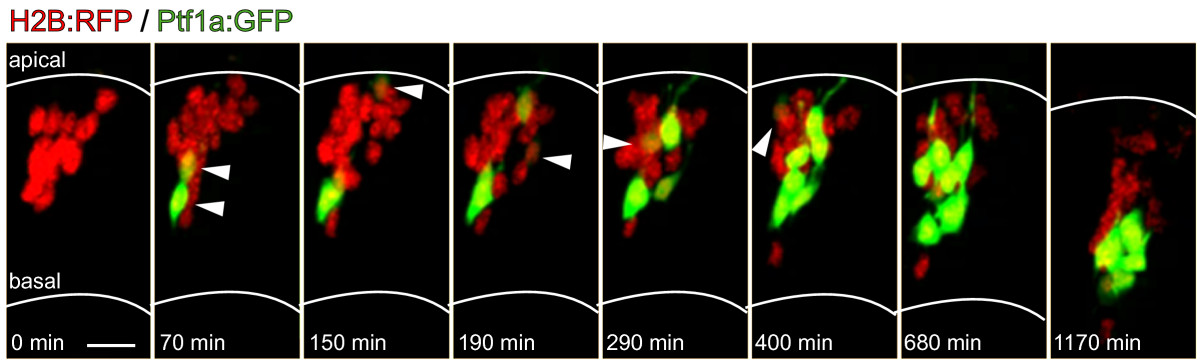
Fig. 3 Ptf1a turns on in postmitotic differentiating cells. Time-lapse images from Additional file 1 (38 to 58 hpf) showing cells transplanted from a Tg(ptf1a:GFP)/H2B:RFP RNA-injected embryo to reveal individual cells. Some transplanted (red) cells turn on Ptf1a:GFP expression in the apical half (top) of the developing neuroepithelium, but not always at the apical surface. White arrowheads indicate cells that have turned on expression of Ptf1a:GFP in that frame. Location of cells indicated by white arrowheads reveal that Ptf1a:GFP in individual cells turns on at different stages of their migration (different depth between apical surface and developing amacrine layer in the middle of the neuroepithelium). Scale bar = 10 μm.