
Image
|
Figure Caption
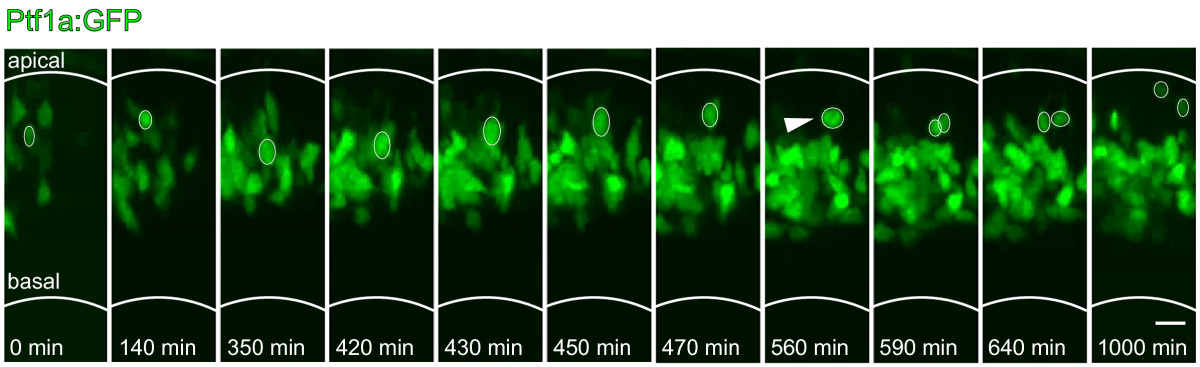
Fig. 2 Temporal onset of Ptf1a expression in Tg(ptf1a:GFP). GFP-positive cells migrate to the centre of the neuroepithelium, where they form a wide band that will become the amacrine cell layer. Some cells (one example marked with white oval) move from this band back apically to the horizontal cell layer, where they undergo an additional division (white arrowhead shows mitosis). No cells are seen to move back to the apical surface and divide as would be expected from progenitor cells. Scale bar = 10 μm.
Figure Data
Acknowledgments
This image is the copyrighted work of the attributed author or publisher, and
ZFIN has permission only to display this image to its users.
Additional permissions should be obtained from the applicable author or publisher of the image.
Full text @ Neural Dev.