Image


                        Figure Caption


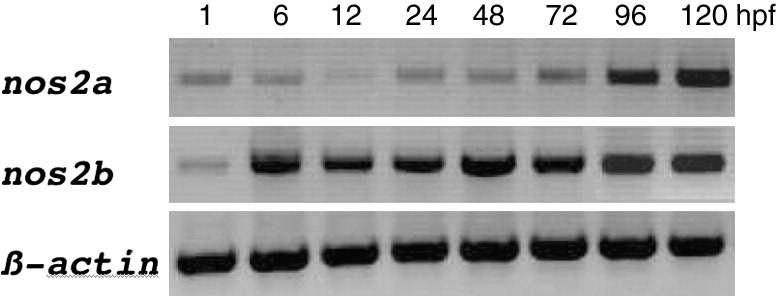
Fig. 4 Temporal expression pattern of nos2a and nos2b during zebrafish development. Analysis was performed by reverse transcriptase-polymerase chain reaction (RT-PCR) using embryos and larvae at indicated stages (hpf: hours post-fertilization). β-actin was used as a housekeeper gene control.
                
                    
                        Figure Data


                        Acknowledgments


This image is the copyrighted work of the attributed author or publisher, and
ZFIN has permission only to display this image to its users.
Additional permissions should be obtained from the applicable author or publisher of the image.
    Reprinted from Gene, 445(1-2), Lepiller, S., Franche, N., Solary, E., Chluba, J., and Laurens, V., Comparative analysis of zebrafish nos2a and nos2b genes, 58-65, Copyright (2009) with permission from Elsevier. Full text @ Gene