
|
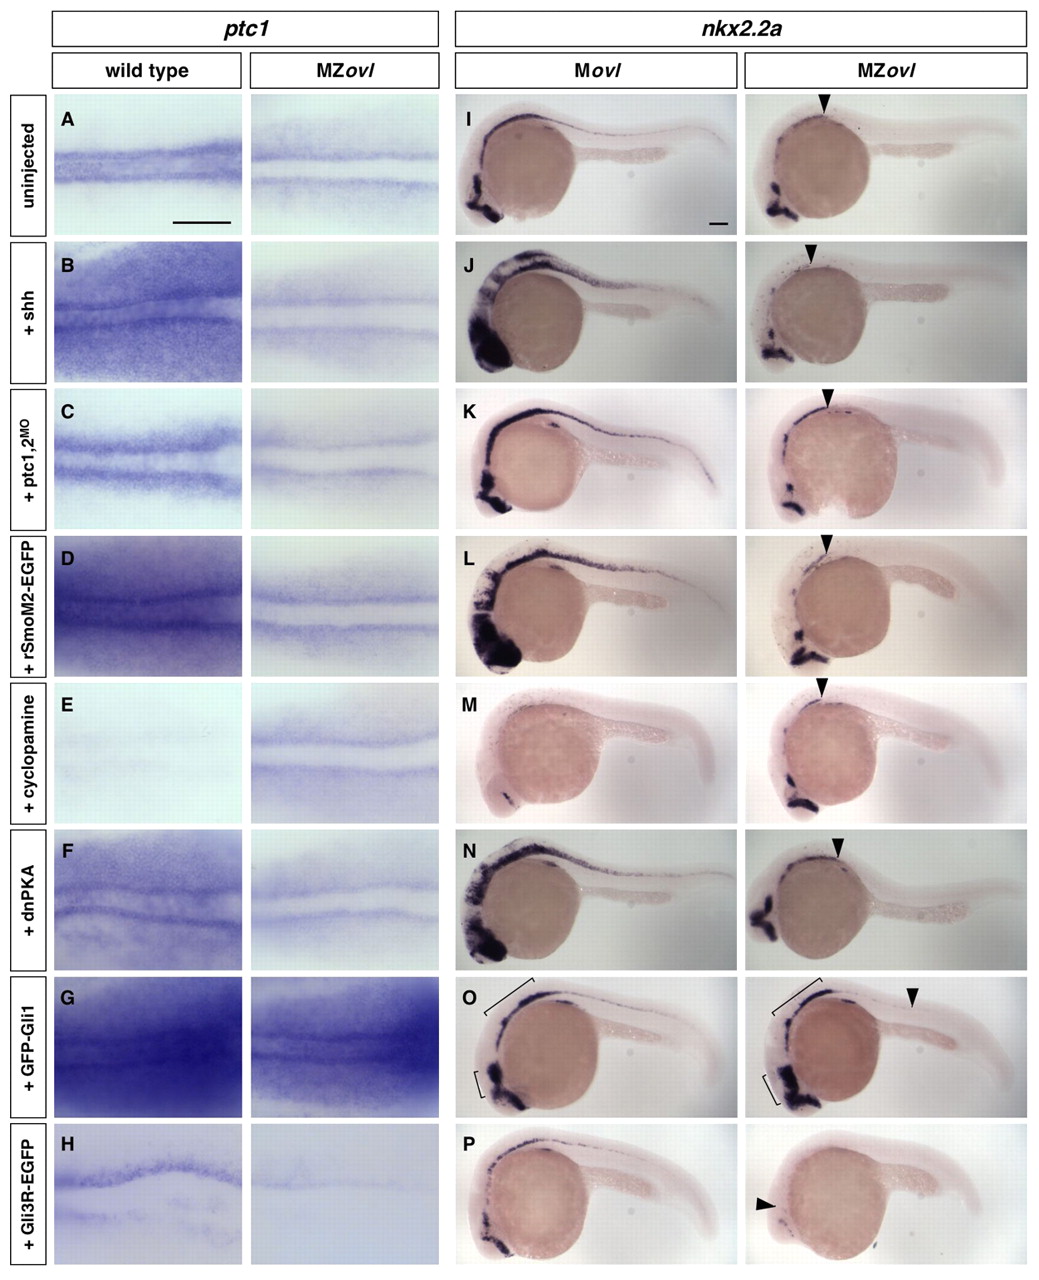
Fig. 4 Epistasis analysis of cilia and the Hh signaling pathway. (A-P)MZovl and control zebrafish embryos were stained for the expression of ptc1 (A-H) and nkx2.2a (I-P) following different manipulations. MZovl embryos are insensitive to ectopic expression of shh mRNA (B,J), depletion of ptc1,2 using morpholinos (C,K), expression of rSmoM2-EGFP mRNA (D,L), treatment with cyclopamine at 100 μM (E,M), and expression of dnPKA mRNA (F,N). By contrast, expression of GFP-Gli1 (G,O) enhances, whereas expression of Gli3R-EGFP (H,P) reduces, ptc1 and nkx2.2a expression. Arrowheads in I-P indicate the posterior extent of nkx2.2a expression in MZovl mutants. Brackets in O indicate regions with expanded nkx2.2a expression. A-H are dorsal views of the presomitic mesoderm of 5-somite stage embryos, and I-P are lateral views of 24 hpf embryos. Scale bars: 100 μm.