
|
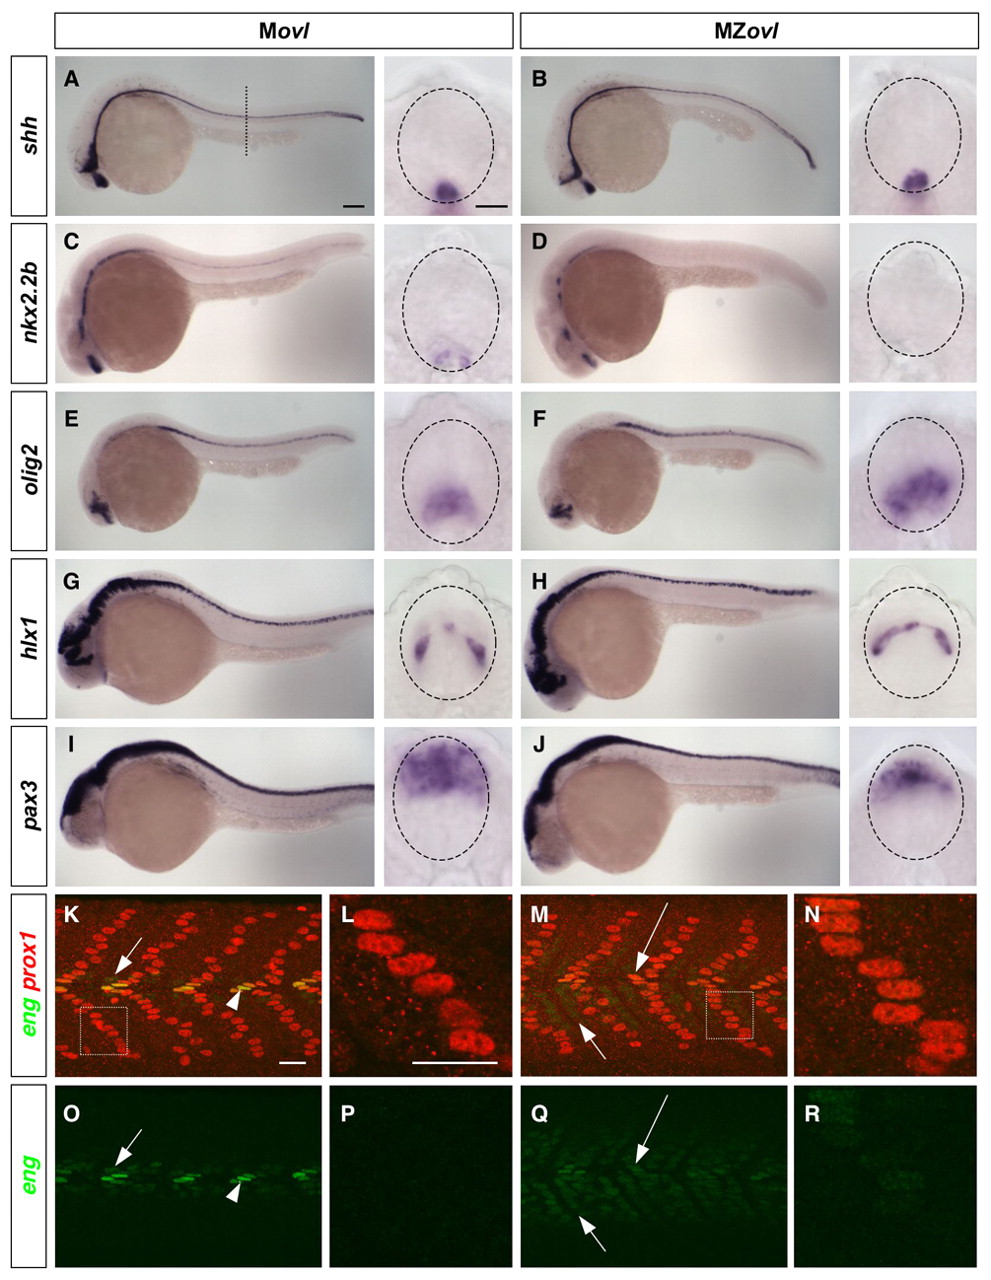
Fig. 3 Neural and somite patterning in MZovl mutants. (A-J) Marker analysis of neural patterning. Movl control zebrafish embryos (A,C,E,G,I) and MZovl mutants (B,D,F,H,J) were stained at 24 hpf for the expression of shh (A,B), nkx2.2b (C,D), olig2 (E,F), hlx1 (G,H) and pax3 (I,J). Each panel contains a lateral view and a cross-sectional view (between somites 10 and 16; dashed line in A indicates plane) with the neural tube outlined (dashed lines). MZovl mutants show normal shh and hlx1 expression (B,H), an absence of nkx2.2b expression (D), expanded olig2 expression (F), and reduced pax3 expression (J) in the neural tube. (K-R) Marker analysis of somite patterning. Movl control embryos (K,L,O,P) and MZovl mutants (M,N,Q,R) were stained at 24 hpf with antibodies against eng (green) and prox1 (red). Muscle pioneers (prox1+, strong eng+, arrowheads in K,O) are replaced with prox1+, weak eng+ cells (long arrows in M,Q) in MZovl mutants. Medial fast fibers (prox1-, weak eng+) are expanded in MZovl mutants (short arrows in M,Q) as compared with Movl embryos (short arrows in K,O). Superficial slow fibers (prox1+) also express a low level of eng in MZovl mutants (N,R) as compared with Movl controls (L,P). K-N are merged confocal images with both green and red channels, and the corresponding green channel images are shown in O-R, respectively. L and N are higher magnification views of the boxed regions in K and M, respectively. Lateral views. Scale bars: 100 μm in lateral views in A-J; 10 μm in cross-sections in A-J; 20 μm in K-R.