
|
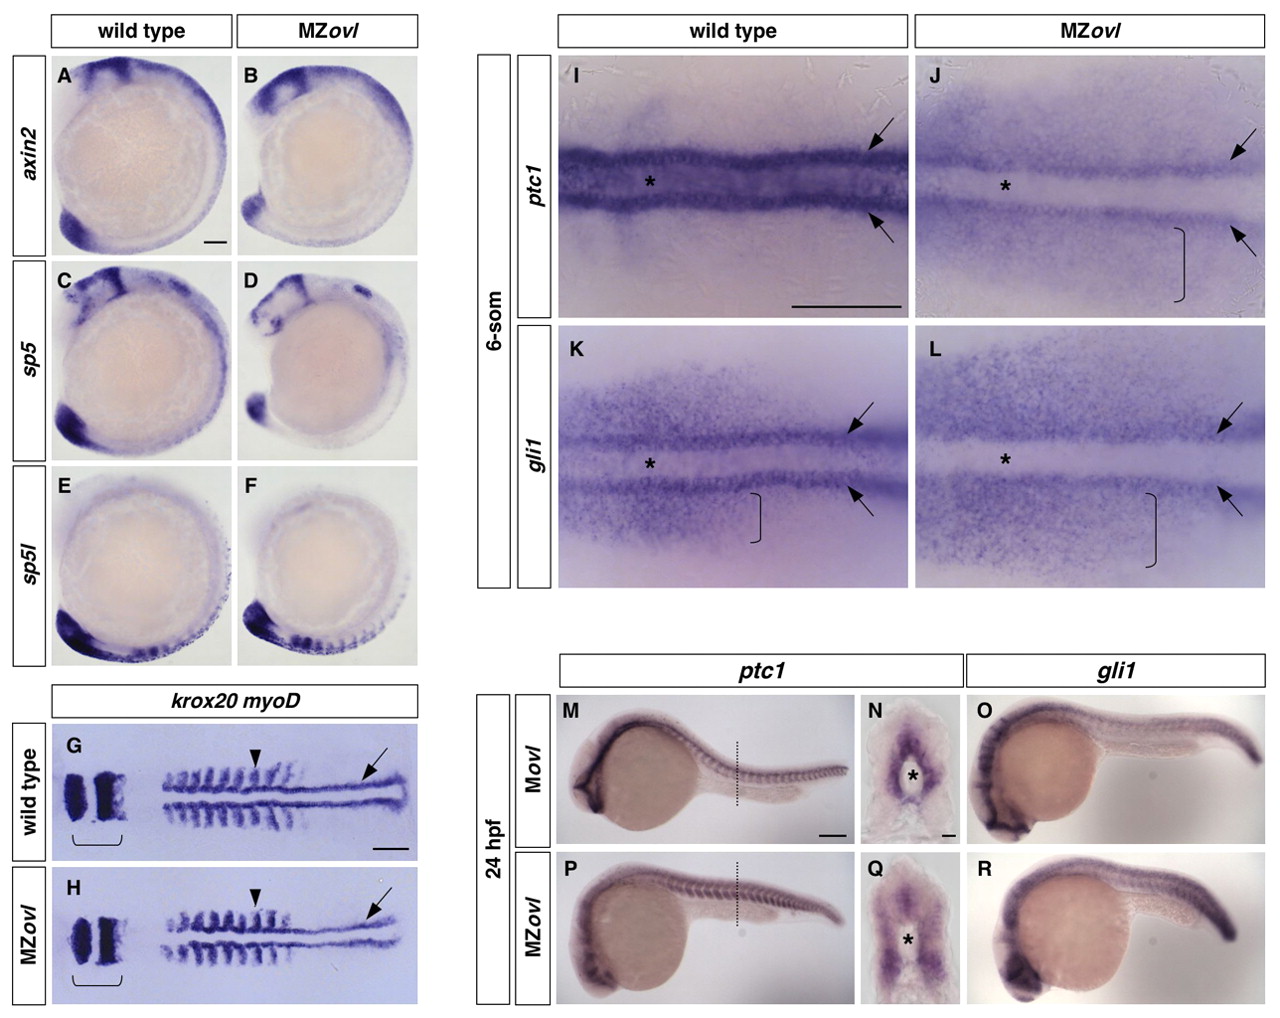
Fig. 2 Characterization of MZovl mutants. (A-F)MZovl mutants (B,D,F) show similar expression of axin2 (A,B), sp5 (C,D) and sp5l (E,F) to wild-type embryos (A,C,E). (G,H)MZovl mutants (H) display similar anterior-posterior axis formation to wild-type embryos (G) as indicated by krox20 (rhombomeres 3 and 5, brackets) and myoD [somites (arrowheads) and adaxial cells (arrows)] expression. (I-L)MZovl mutants show reduced ptc1 and gli1 expression in the ventral neural plate (out of focus, asterisks) and adaxial muscle cells (arrows), and expanded expression in the paraxial mesoderm (brackets). (M-R)MZovl mutants (P-R) show reduced, but expanded, ptc1 and gli1 expression compared with control Movl embryos (M-O). N and Q are cross-sectional views of M and P (dashed lines indicate plane), respectively, with the notochord marked by an asterisk. In situ hybridization was carried out in embryos at the 15-somite stage (A-F), 9-somite stage (G,H), 6-somite stage (I-L) and at 24 hpf (M-R). A-F,M,O,P,R are lateral views and G-L are dorsal views. Scale bars: 100 μm in A-M,O,P,R; 10 μm in N,Q.