
|
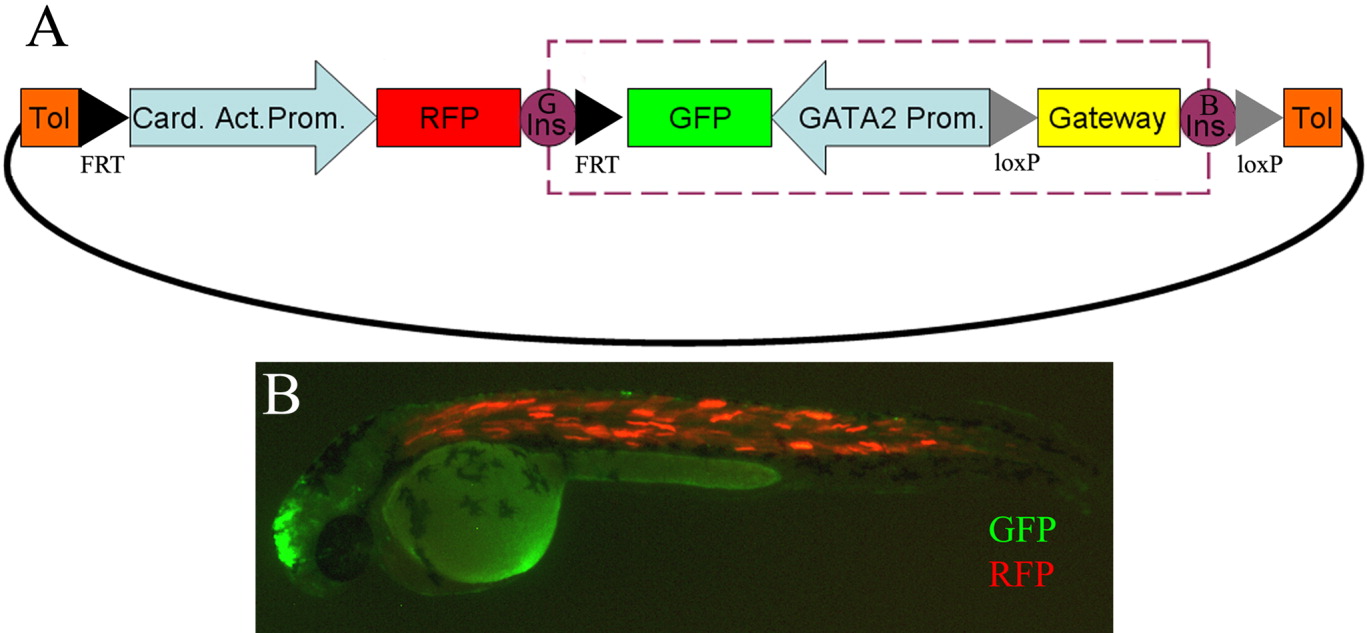
Fig. 5 A: Diagram of the Zebrafish Enhancer Detection (ZED) vector. Orange boxes are the Tol2 transposase recognition sequences. This vector is composed of two different cassettes. The transgenesis internal control cassette is composed of the Cardiac Actin promoter (pale blue arrow), and red fluorescent protein (RFP; red block). The enhancer detection cassette contains a Gateway entry site, represented by a yellow box, the gata2 minimal promoter, shown in pale blue arrow, and the enhanced green fluorescent protein (EGFP) reporter gene, marked with a Green box. This enhancer detection cassette is flanked by two Insulator sequences represented by Violet circles that protect the enhancer detection cassette (dashed purple box) from position effects. The left insulator corresponds to the GAB insulator (G Ins) from the mouse tyrosinase gene and the right to the 5′HS4 insulator (B Ins) from the chicken β-globin gene. Additionally, two excision cassettes are also present. One is mediated by Flipase (black triangles), and the other by Cre recombinase (gray triangles). B: F0 injected embryos with the ZED vector containing the Z48 enhancer at 48 hours postfertilization (hpf) show both GFP expression in the midbrain (Green) and RFP expression in the somites (Red) in 70% of the injected embryos (n > 150).