
Image
|
Figure Caption
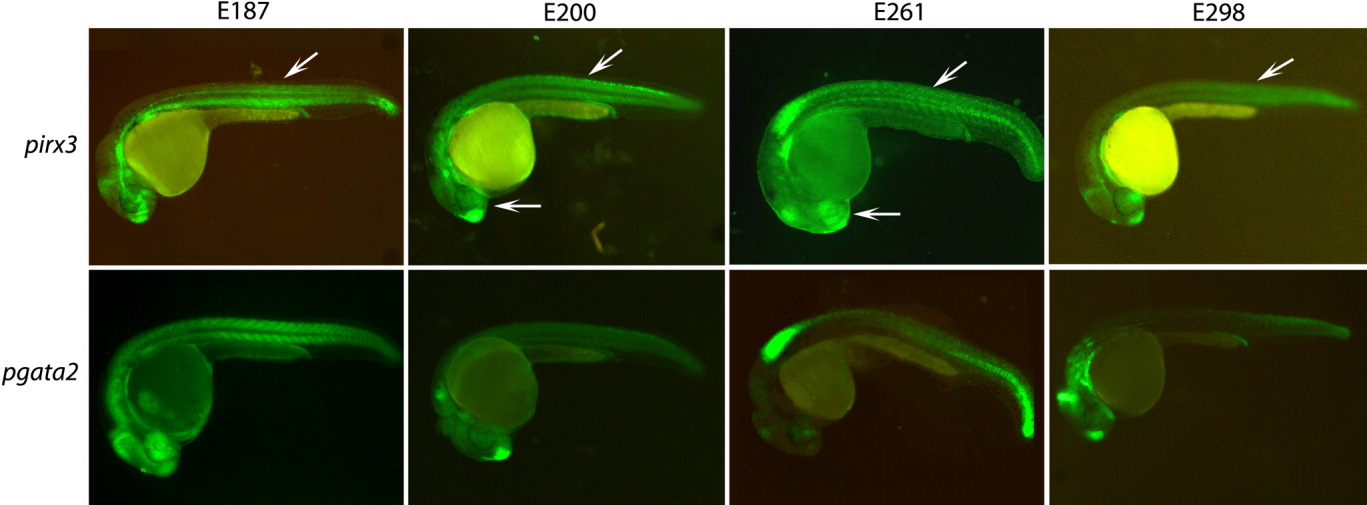
Fig. 1 Capacity of irx3 and gata2 promoters to respond to different enhancers. Two or more independent F1 stable transgenic lines were generated with the four tested enhancers (E187, E200, E261, and E298, from left to right columns) positioned 5′ of either the irx3 (upper row) or the gata2 (lower row) minimal promoters, both driving green fluorescent protein (GFP) expression. Both irx3 and gata2 minimal promoters respond efficiently to all four enhancers. However, the irx3 promoter shows some promoter-specific expression in somites and eye (arrows).
Acknowledgments
This image is the copyrighted work of the attributed author or publisher, and
ZFIN has permission only to display this image to its users.
Additional permissions should be obtained from the applicable author or publisher of the image.
Full text @ Dev. Dyn.