
|
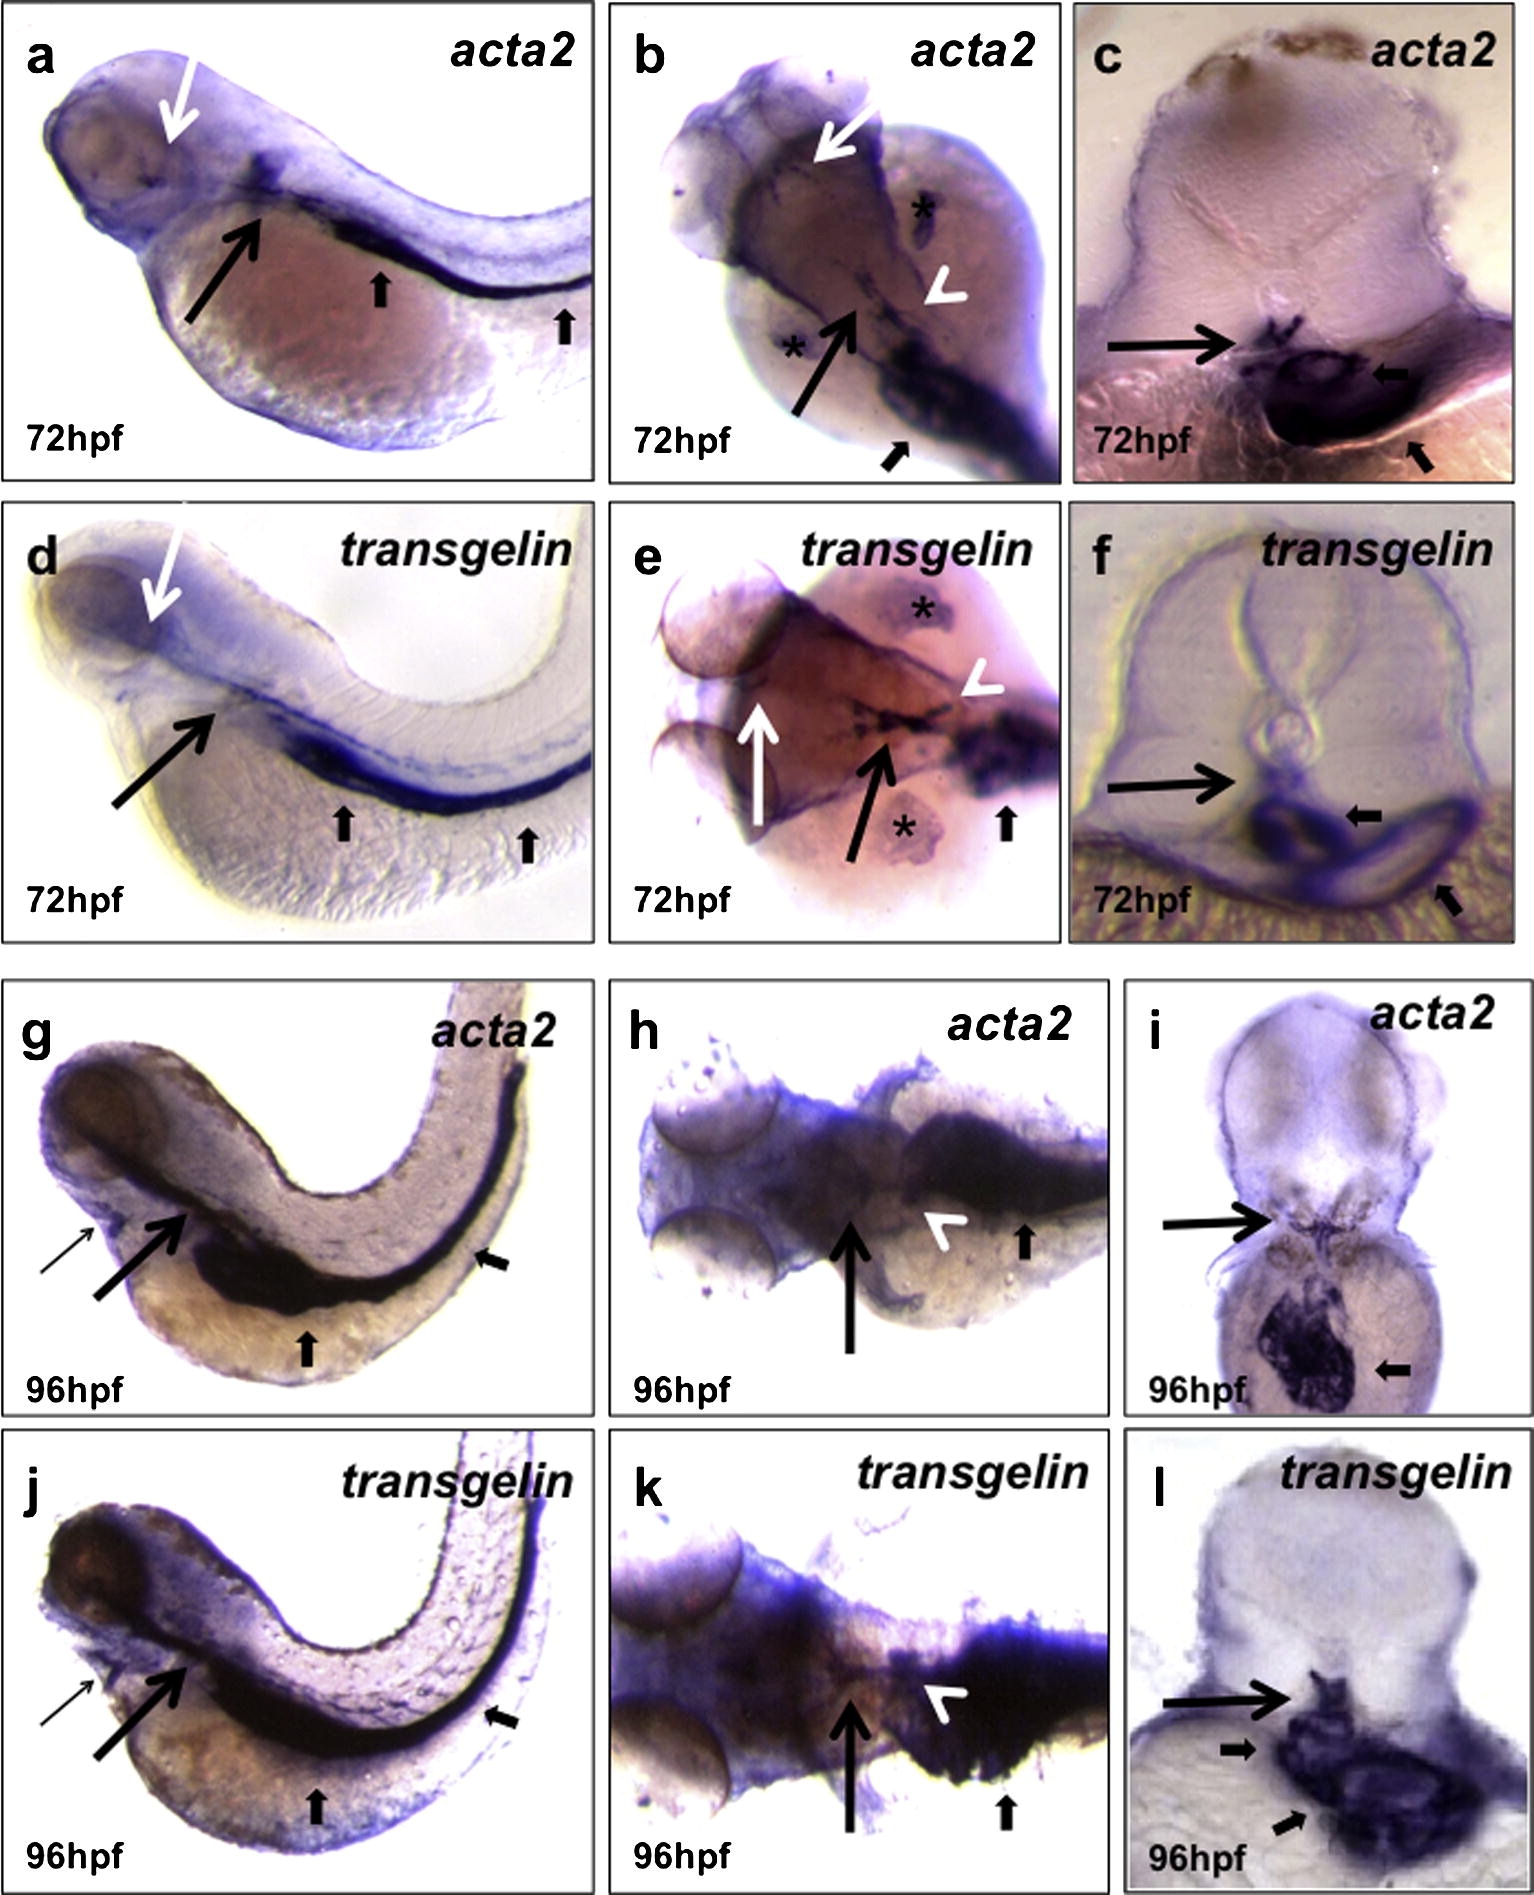
Fig. 2 Mural cell markers are observed in specific perivascular districts. Wild-type larvae analyzed for acta2 (a–c; g-i) and transgelin (d–f; j–l) expression at 72 (a–f) and 96 (g–l) hpf. At 72 hpf, acta2 and transgelin are strongly expressed in the anterior lateral dorsal aortae (LDA) (long black arrows), internal carotid arteries (ICA) (long white arrows) and anterior mesenteric artery (AMA) (white arrowheads). At 96 hpf, a specific and diffuse staining appears at the Y junction of the bilateral dorsal aortae (long black arrows), AMA (white arrowheads) and in the heart region at the level of the bulbus arteriosus (BA) and ventral aorta (VA) (thin arrows). Visceral smooth muscle around the gut and swim bladder (short black arrows) are also evident at both stages. Cross-section analyses reveal specific staining around the dorsal aorta (vascular MCs) (long black arrows) and the gut epithelium (visceral smooth muscle cells) (short black arrows). Images (a, d, g and j) are lateral views, anterior to the left; (b, e, h and k) are dorsal views, anterior to the left; (c, f, i and l) are cross-sections at the level of the 2nd somite. At 72 hpf, both genes are also expressed in the fin buds (asterisks).
Reprinted from Mechanisms of Development, 126(8-9), Santoro, M.M., Pesce, G., and Stainier, D.Y., Characterization of vascular mural cells during zebrafish development, 638-649, Copyright (2009) with permission from Elsevier. Full text @ Mech. Dev.