
|
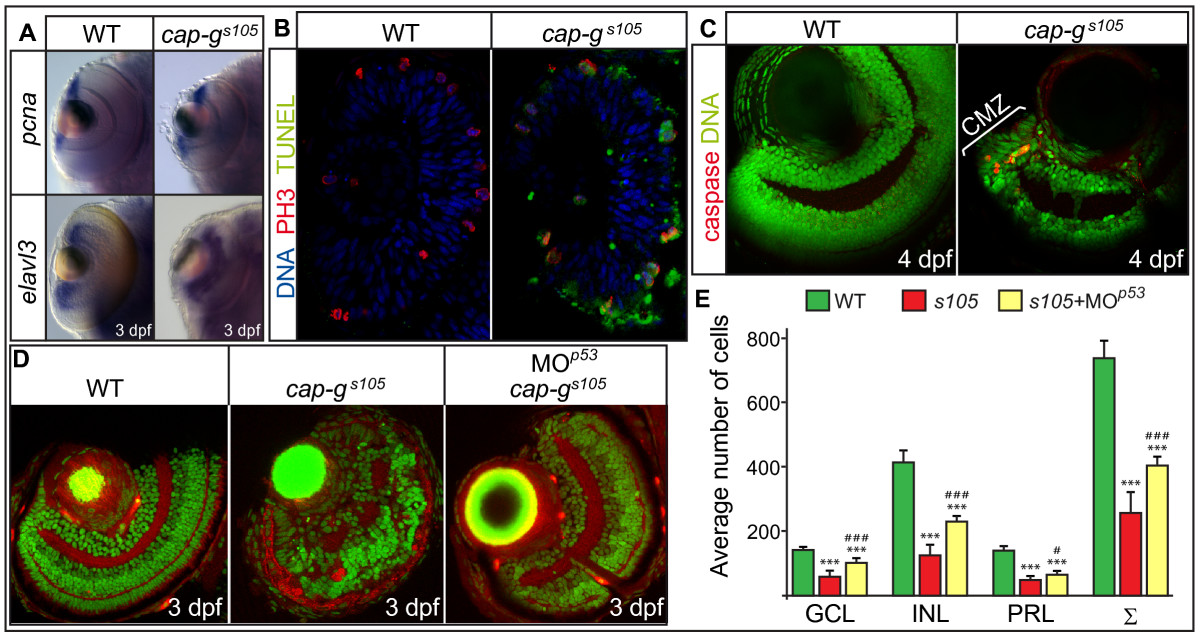
Fig. 3 Loss of CAP-G causes p53-mediated apoptosis within the retina. (A) Retinal expression of the proliferation marker pcna or of neurogenesis marker elval3 is not affected in cap-gs105 mutants as detected by whole-mount in situ hybridizations at 3 dpf. (B) Transverse cryosections of embryonic retinae were stained against phosphorylated histone 3 which marks mitotic nuclei (red), TUNEL to detect apoptotic cells (green), and nuclei counterstained with DAPI (blue) at 24 hpf. Predominantly mitotic cells which divide at the ventricular side of the retina are apoptotic in cap-gs105 mutants at 24 hpf. (C) Transverse vibratome sections of 4 dpf retinae stained against activated caspase 3 to detect apoptotic cells (red) and nuclei counterstained with propidium iodide (green). At this stage, proliferation is restricted to the CMZ. In cap-gs105 mutants, cell death is restricted to the CMZ which indicates that proliferative cells are eliminated. (D) Transverse vibratome sections of embryonic retinae counterstained with phalloidin to visualize plexiform layers (red) and propidium iodide (green). cap-gs105 mutants injected with MOp53show a rescue of retinal development and display correct retinal layering. (E) Quantification of cell numbers within different retinal cell layers. Propidium iodide stained transverse retinal sections were used to determine average counts for wild-type (n = 9 section planes, 5 embryos), cap-gs105 mutants (n = 11 section planes, 7 embryos) or cap-gs105 mutant/p53 morphants (n = 9 section planes, 6 embryos). The average sum of cap-gs105 mutant retinal cells is reduced by 65% compared with wild-type. In comparison, the average sum of cap-gs105 mutant/p53 morphant retinal cells is reduced only by 43% compared with wild-type. Therefore, the severe reduction in retinal cell numbers is in part caused by p53-mediated apoptosis. Data represent average cell numbers per retina ± SD. T-test p-values for cell number differences in comparison to wild-type: ***, p < 0.001; and in comparison to cap-gs105: #, p < 0.05; ### p < 0.001.