
|
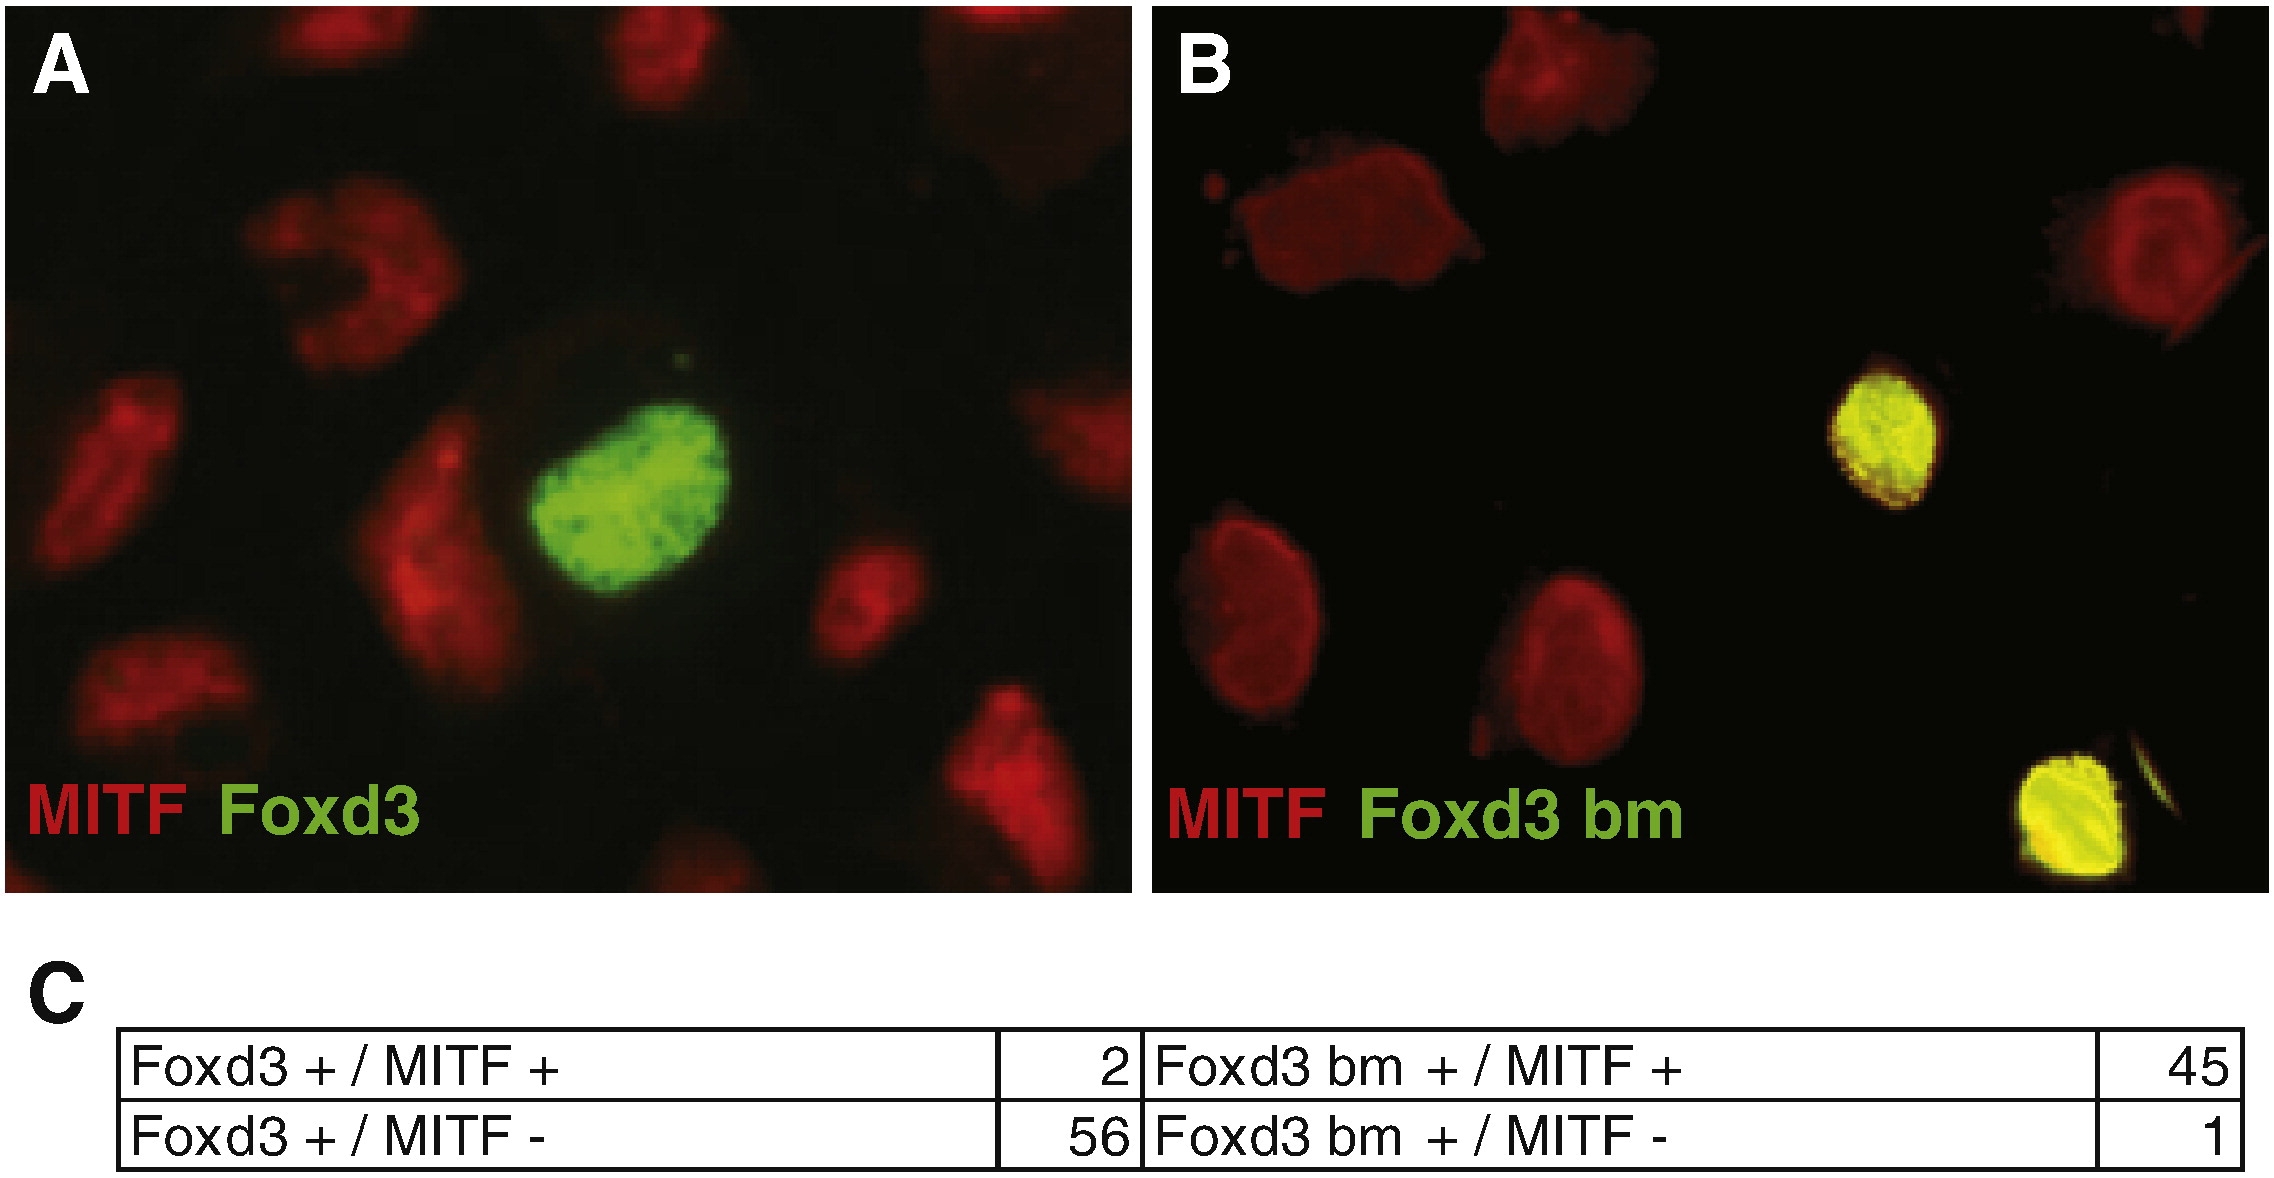
Fig. 5 Melb-a cell culture analysis displays Foxd3 repression of endogenous MITF expression. (A, B) Transfected melb-a (mouse melanoblast) cells, (20x). Red: anti-MITF rabbit polyclonal, green: anti-Myc mouse monoclonal. (A) Cells transfected with full-length zebrafish foxd3-myc sequence show nuclear exclusion of endogenous mouse MITF. (B) Cells transfected with DNA-binding mutant version of zebrafish foxd3-myc display co-localized staining with endogenous mouse MITF. (C) Cell counts collected from 5 separate transfection experiments. 56 melb-a cells transfected with full-length foxd3 became MITF negative, 2 remained positive. 1 melb-a cell transfected with DNA-binding mutant version of zebrafish foxd3 became MITF negative, 45 transfected cells remained positive.
Reprinted from Developmental Biology, 332(2), Curran, K., Raible, D.W., and Lister, J.A., Foxd3 Controls Melanophore Specification in the Zebrafish Neural Crest by Regulation of Mitf, 408-417, Copyright (2009) with permission from Elsevier. Full text @ Dev. Biol.