
Image
|
Figure Caption
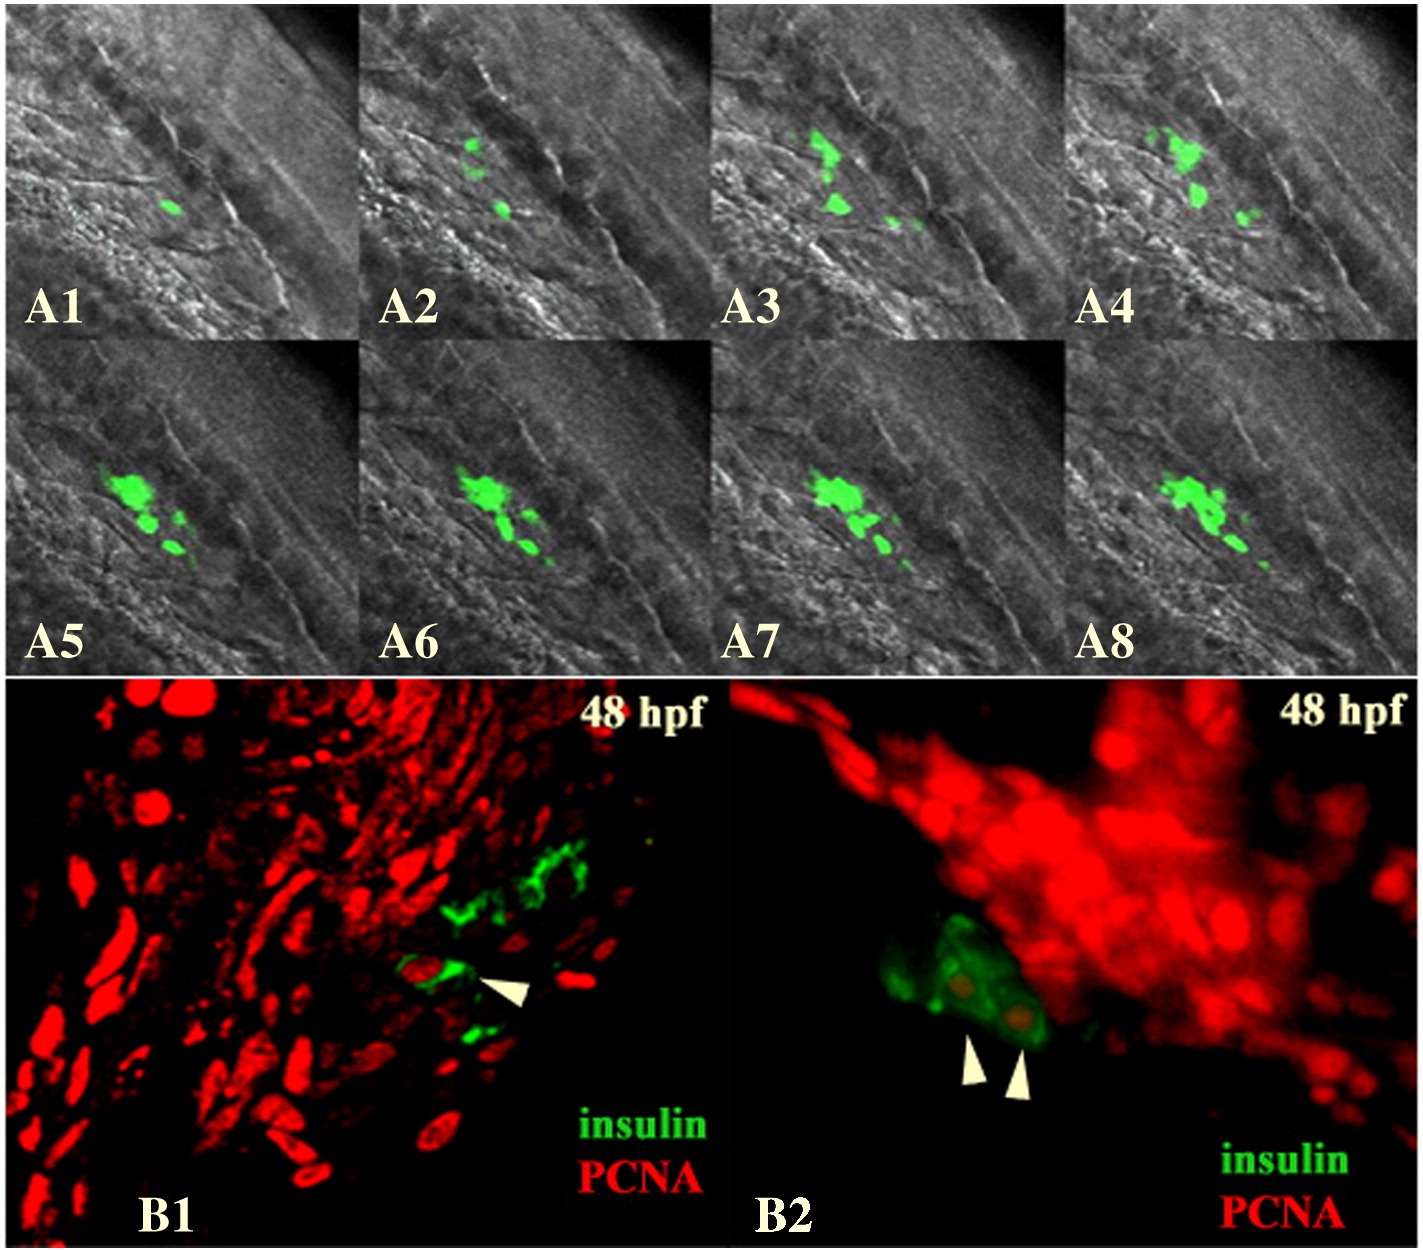
Fig. 2 Generation of insulin-expressing beta cells during embryonic and larval stages. (A) Fig. A1 to A8 are projections of confocal stacks recorded every 30 min from a dorsal view of a representative 20–25 hpf ins:GFP transgenic embryo. The whole movie (39 stacks, 5 hrs) can be seen in the Supplemental Movie 1. (B1, B2) Immunofluorescence with a anti-PCNA (red) and anti-insulin (green) on 48 hpf larva. Proliferating beta cells are indicated by an arrowhead.
Figure Data
Acknowledgments
This image is the copyrighted work of the attributed author or publisher, and
ZFIN has permission only to display this image to its users.
Additional permissions should be obtained from the applicable author or publisher of the image.
Reprinted from Developmental Biology, 332(2), Moro, E., Gnügge, L., Braghetta, P., Bortolussi, M., and Argenton, F., Analysis of beta cell proliferation dynamics in zebrafish, 299-308, Copyright (2009) with permission from Elsevier. Full text @ Dev. Biol.