
Image
|
Figure Caption
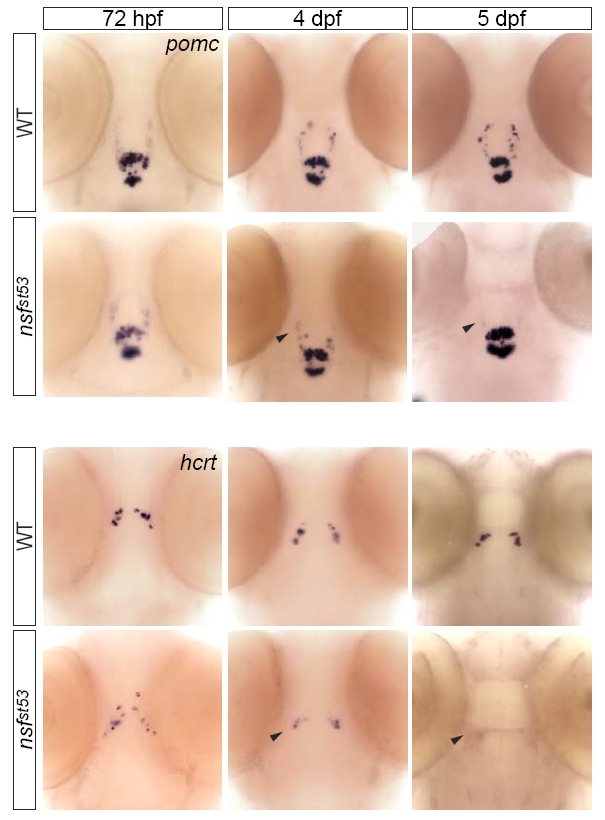
Fig. S1 Loss of hypothalamic markers occurs during embryo-to-larva transition. Whole-mount expression patterns are shown for pomc (top panels) and hcrt (bottom panels) in 72hpf, 4dpf, and 5dpf WT and nsfst53 zebrafish (n≥15 per timepoint). Progressive loss of transcripts are noted (black arrowheads).
Acknowledgments
This image is the copyrighted work of the attributed author or publisher, and
ZFIN has permission only to display this image to its users.
Additional permissions should be obtained from the applicable author or publisher of the image.
Full text @ Neural Dev.