
|
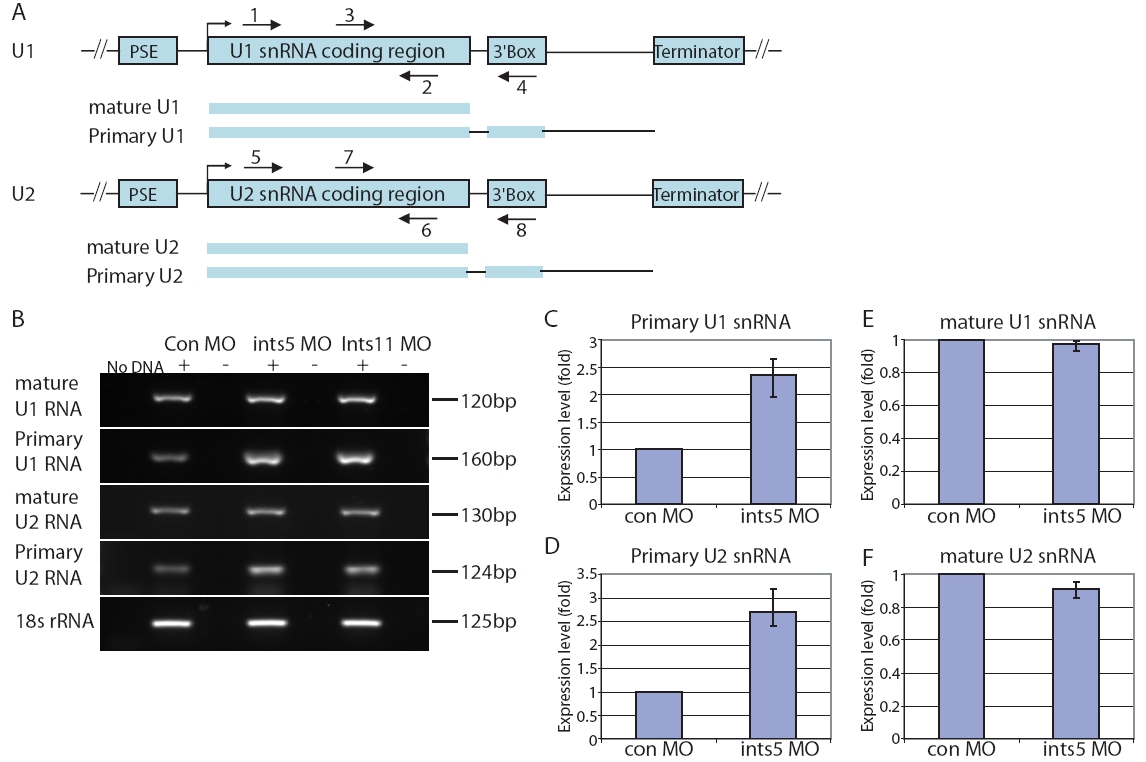
Fig. S6 Knockdown of ints5 leads to the accumulation of unprocessed primary U1/U2 snRNAs. (A) Diagrams of U1 and U2 snRNA genes. Location of the proximal promoter elements (PSE), snRNA coding region, the 3′ end formation signals (3′ Box) and terminators are indicated in blue boxes. Schematic representation below shows mature and primary immature forms of U snRNA transcripts. Numbered arrows indicate the position of primers used to detect expression of the various U snRNAs. (B) Representative RT-PCRs to detect mature and primary U1 and U2 snRNAs at 8 hpf with the following primer pairs: mature U1, 1+2; primary U1, 3+4; mature U2, 5+6; primary U2, 7+8. Expression of 18s rRNA is shown as a control. (C-F) Histograms to show expression level of primary U1 (C), primary U2 (D), mature U1 (E) and mature U2 (F) transcripts in injected embryos. Expression levels were measured at 8 hpf by semi-quantitative RT-PCR, normalized with respect to the level of the 18s rRNA internal control, and shown as a fold change relative to control embryos. Histograms show data obtained from three independent injection experiments.