
|
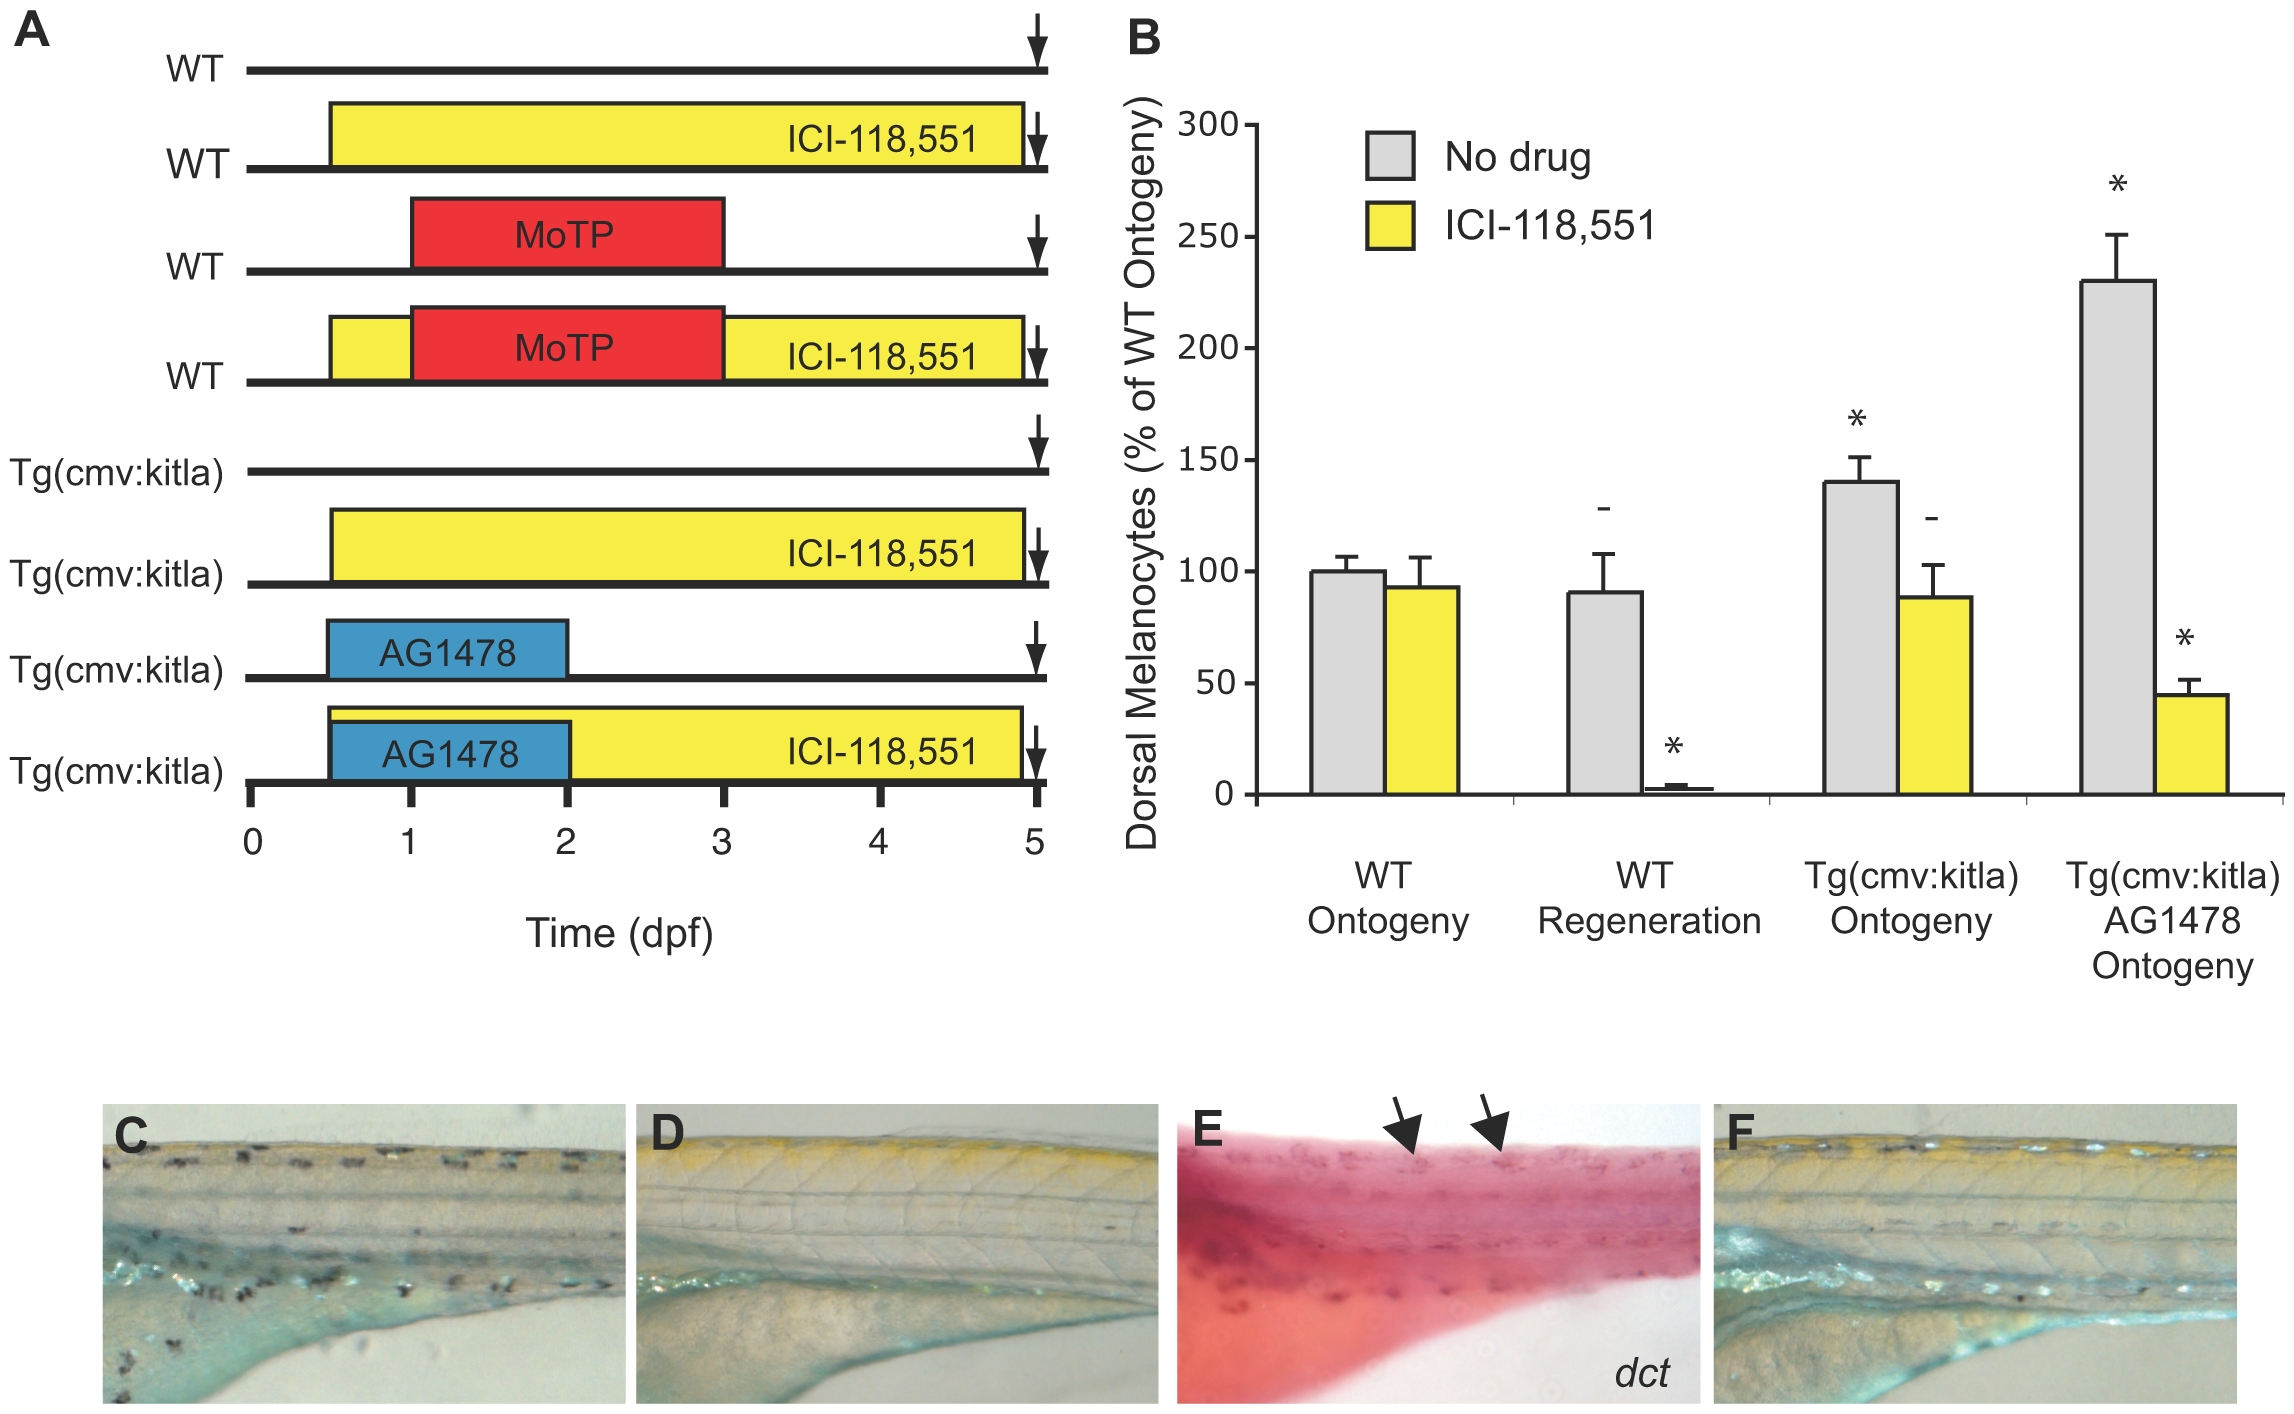
Fig. 6 The regeneration specific drug, ICI-118,551, reveals that excess melanocytes in PT2hsp70:kitla larvae arise from the MSC lineage.
(A) Cartoon of drug treatment timeline. (B) Quantitative data for ontogeny and regeneration represented as percentage of WT melanocyte numbers. Error bars show standard deviations, * P<0.05, - P>0.05 (Student′s t-test, N>7). (C) WT larvae treated with ICI-118,551 develop faintly melanized ontogenetic melanocytes, in contrast to (D) failure to develop melanized melanocytes when challenged to regenerate in the presence of ICI-118,551. (E) In situ analysis reveals regeneration proceeds to the dct+ melanoblast stage (arrows) in the presence of ICI-118,551. (F) ICI-118,551 treated PT2hsp70:kitla embryos develop similar numbers of faintly melanized melanocytes as ICI-118,551 treated embryos shown in (C). Differences in iridophore appearance between (C) and (F) are results of slightly different illumination conditions.