
|
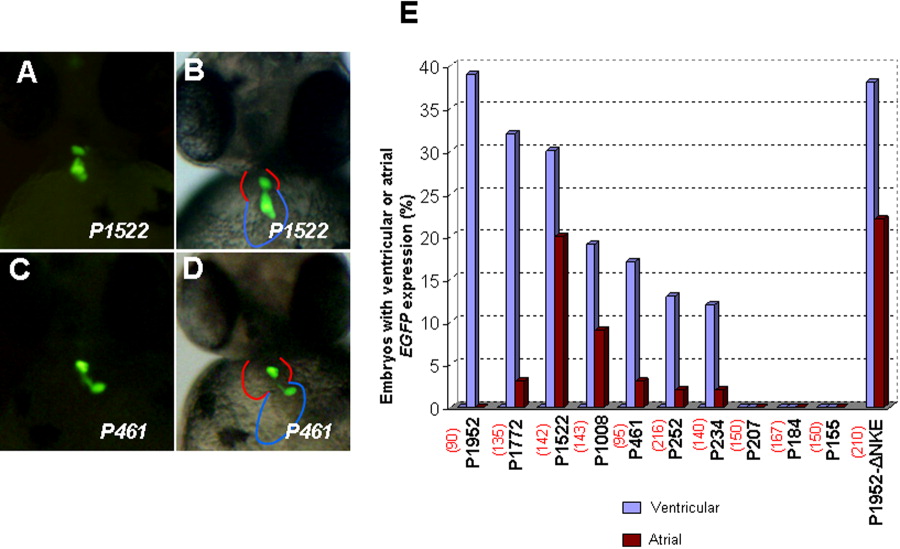
Fig. 4 vmhc promoter deletions caused ectopic EGFP expression in the atrium. A-D: Fluorescent optics revealing the ectopic EGFP expression in the atrium and its normal ventricular expression in embryos with P1522 injection (A,B), as well as reduced EGFP expression in both chambers with P461 injection (C,D). Red and blue lines sketch the ventricle and atrium, respectively. E: Bar graph showing the percentage of embryos that express EGFP in the ventricle (blue) or the atrium (magenta) in embryos injected with each construct. The total number of embryos injected with each construct is shown in parentheses. The ventricular expression data is the same as Figure 3.