
Image
|
Figure Caption
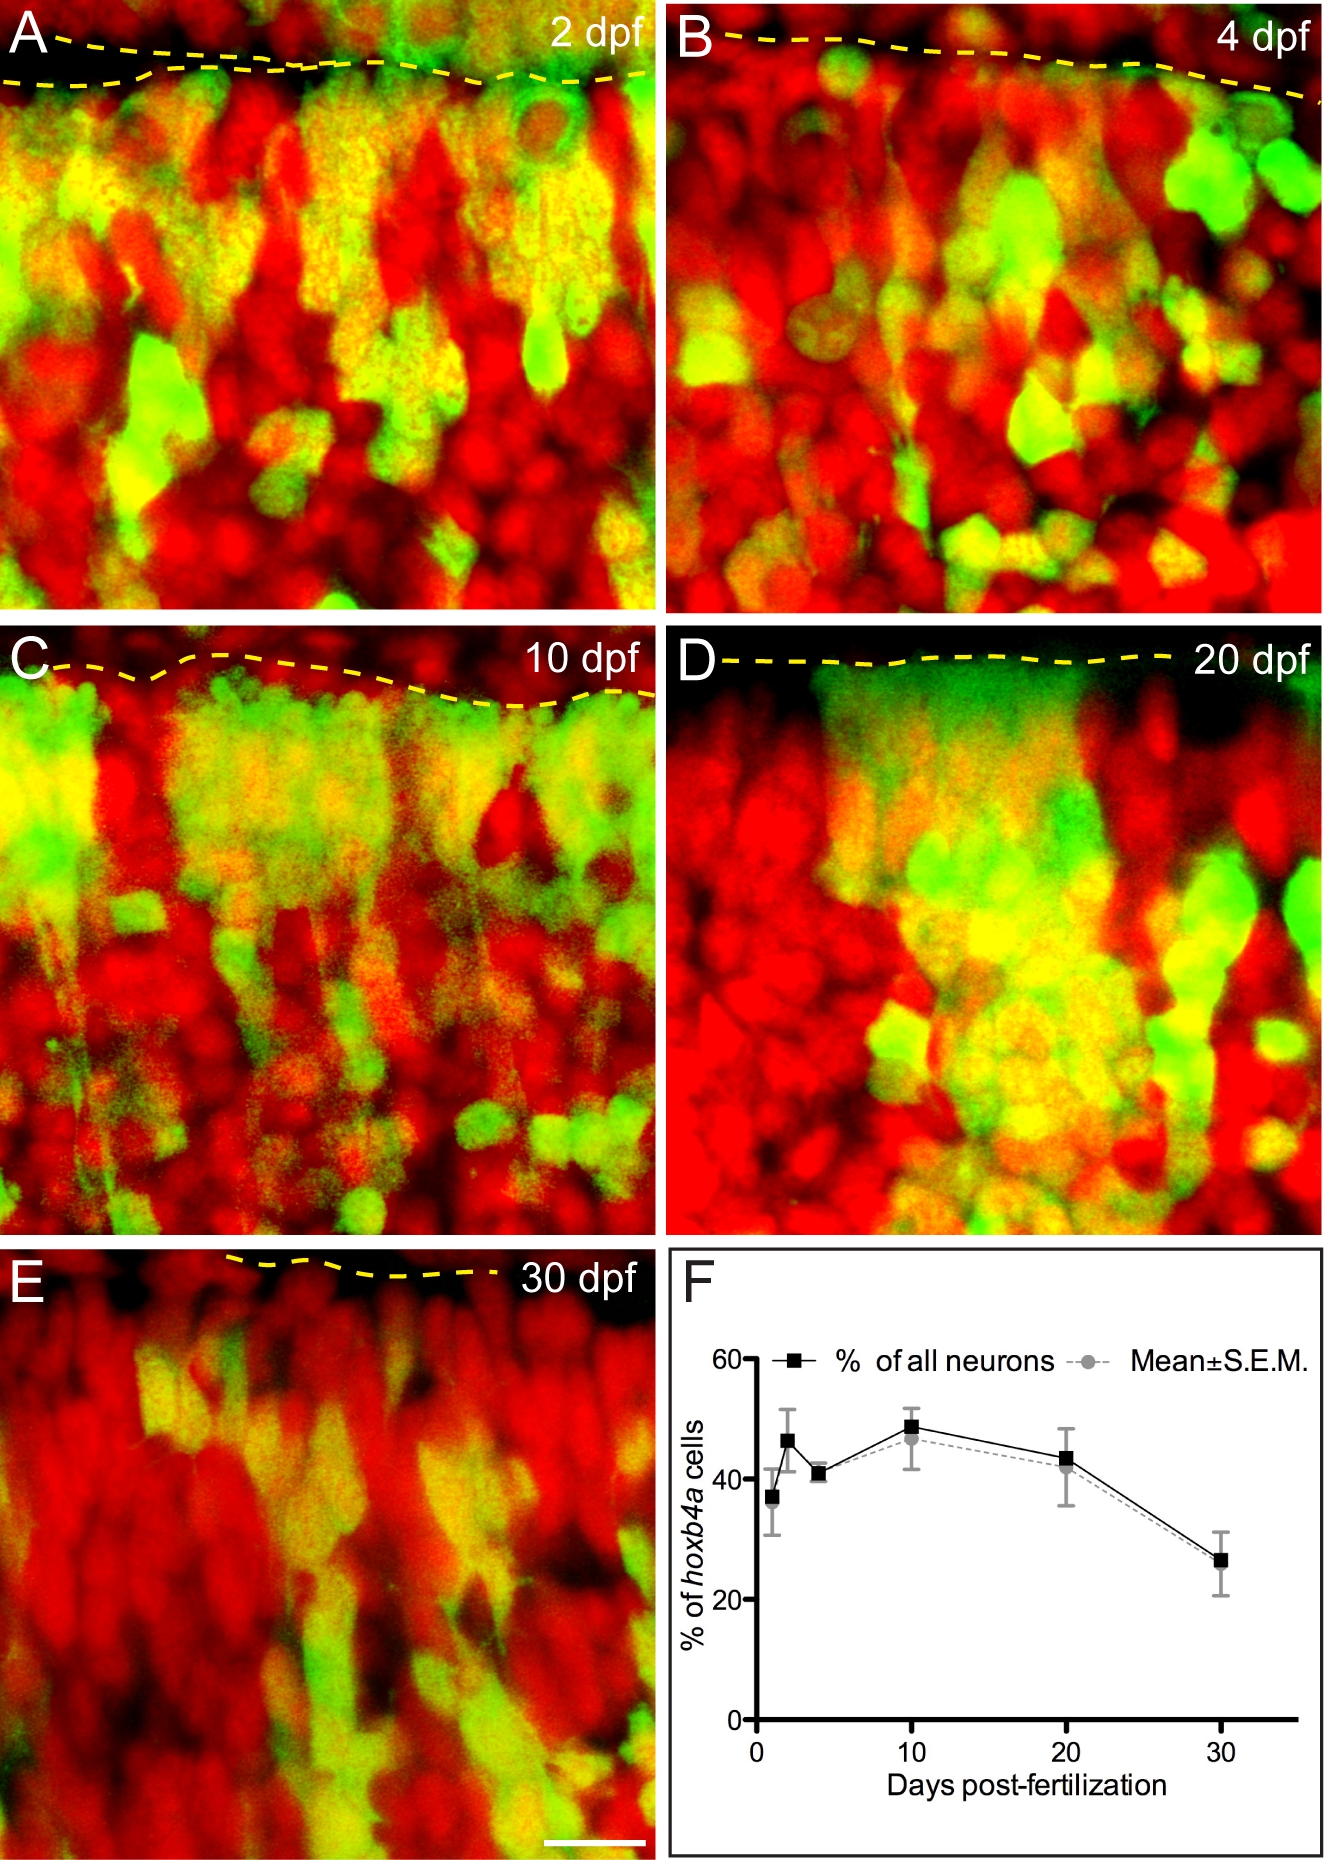
Fig. S2 Mosaic hoxb4a activity. (A–D) Single plane images showing hoxb4a (green) and Hoechst nuclear counterstain (red) acquired from the dorsal 60 μm of r7–8 at 2 (A), 4 (B), 10 (C) and 20 (D) dpf in transgenic zebrafish. Dashed lines mark the ventricular surface. (E) Graph showing the percentage change of hoxb4a cells from 1 to 30 dpf in dorsal r7–8. Scale bars = 10 μm.
Acknowledgments
This image is the copyrighted work of the attributed author or publisher, and
ZFIN has permission only to display this image to its users.
Additional permissions should be obtained from the applicable author or publisher of the image.
Full text @ PLoS One