
|
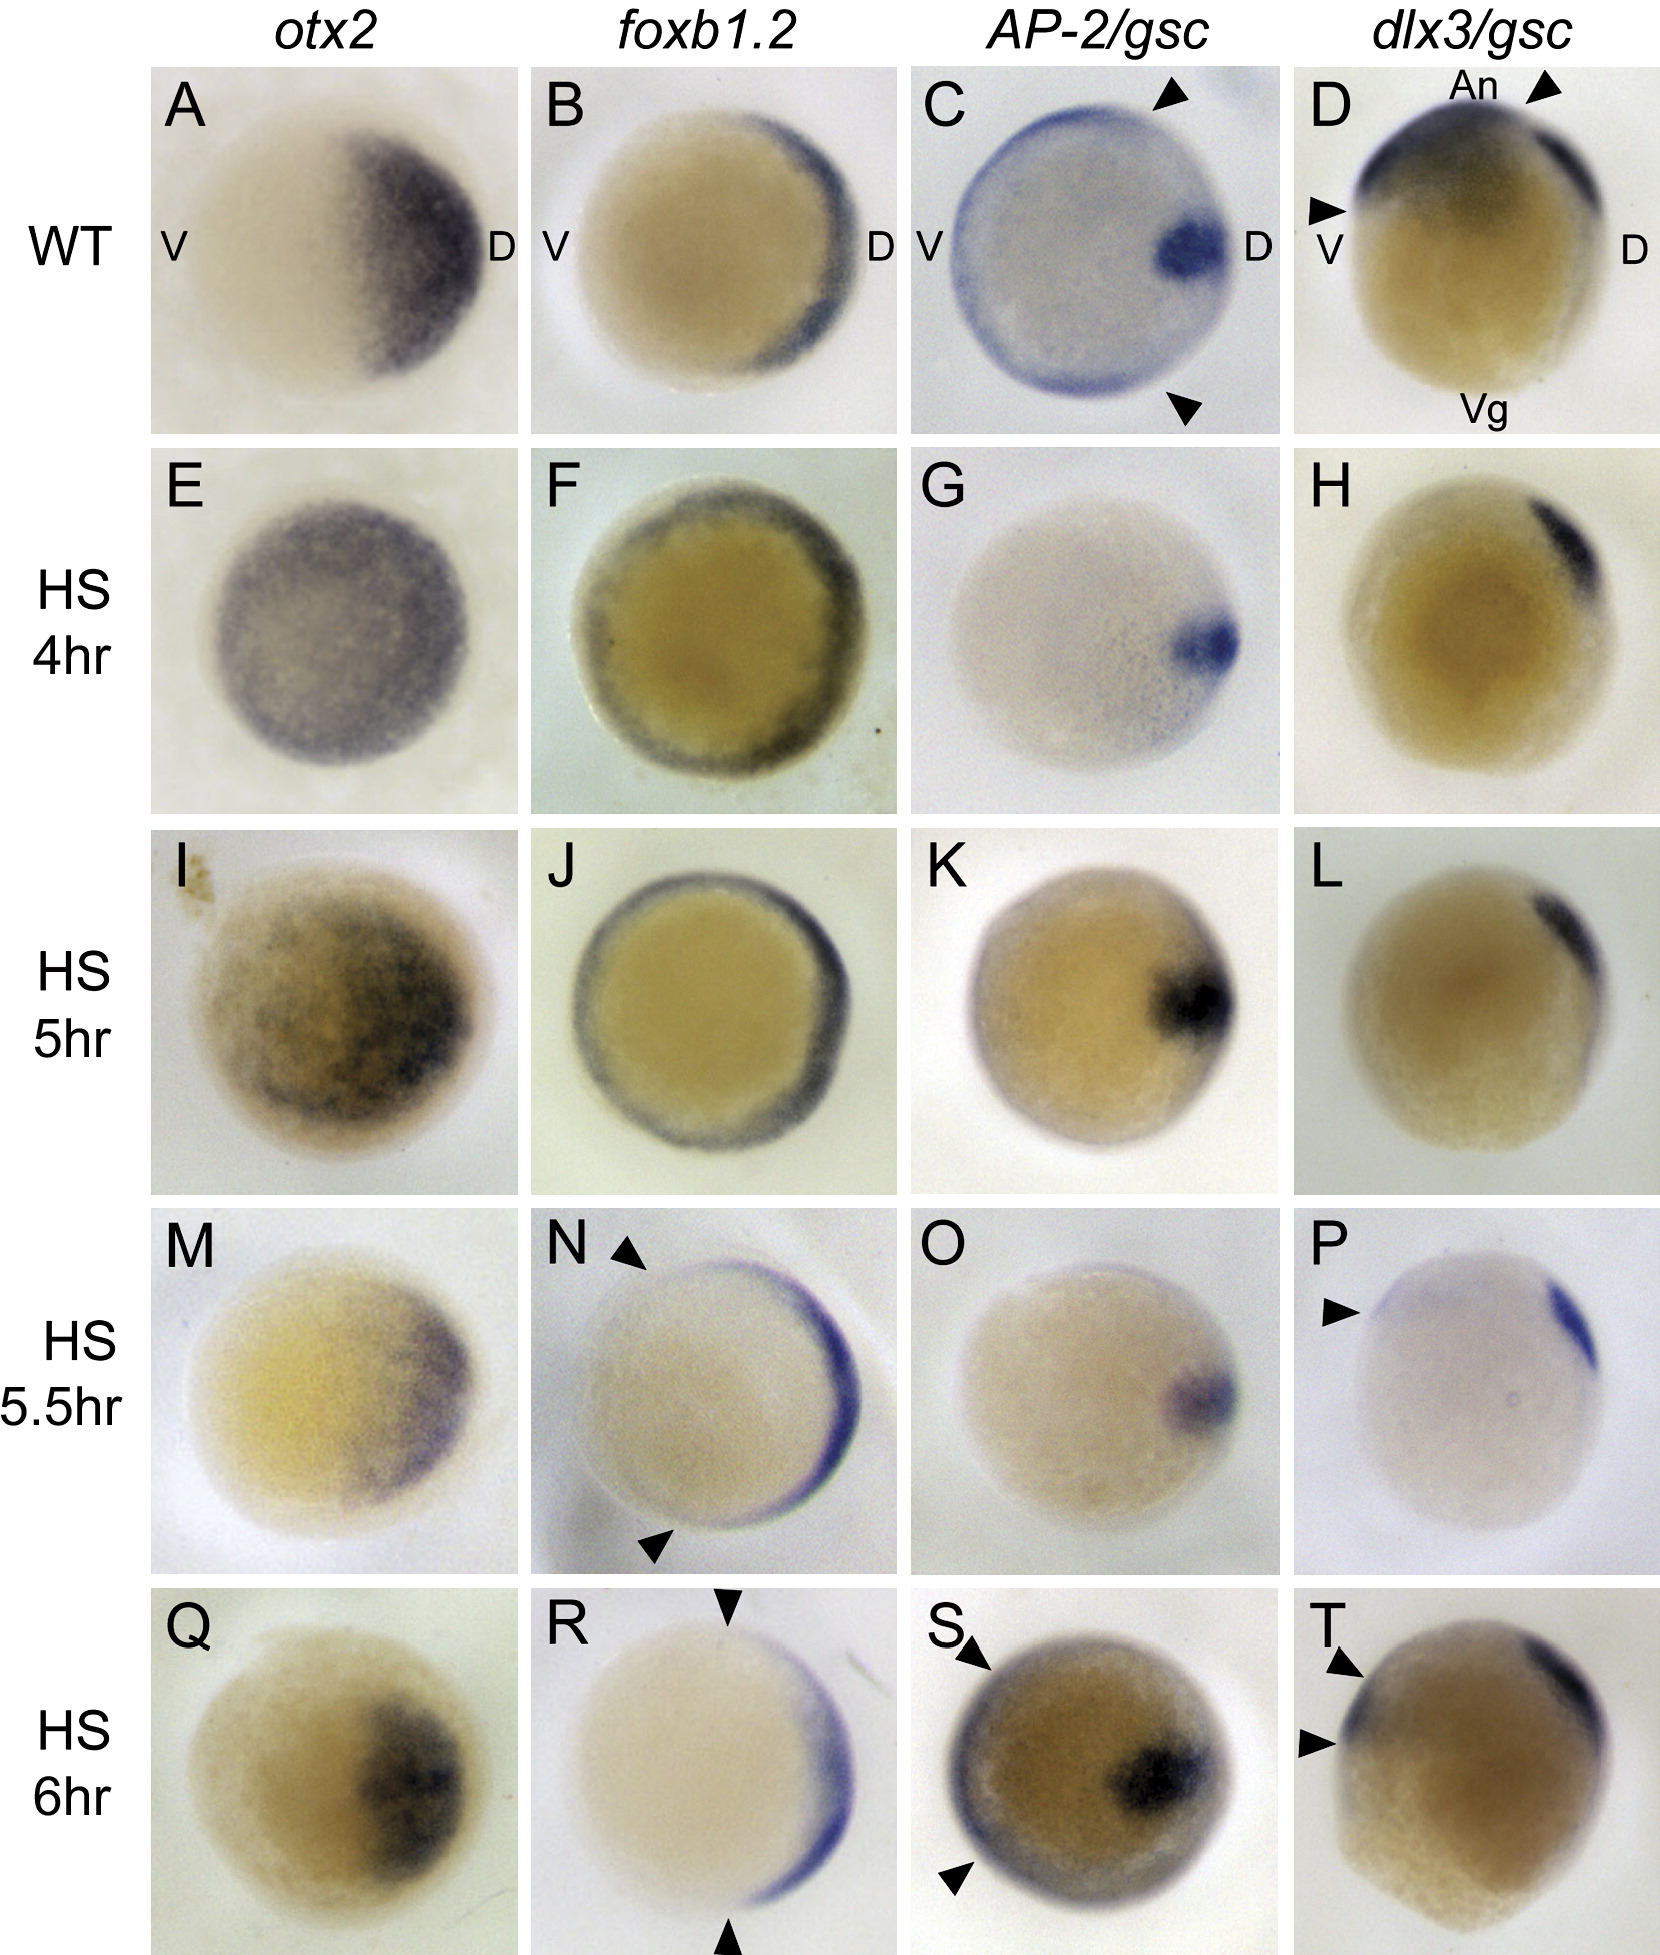
Fig. 4 Tg(hsp70:chd)-Induced Dorsalization Is Apparent during Gastrulation
Whole-mount in situ hybridization of nontransgenic heat-shocked WT siblings (A–D) compared to heat-shocked transgenic embryos (E–T). otx2 expression at 60%–65% epiboly in prospective anterior neural tissue in WT (A), or transgenic following HS at 4 hpf ([E], n = 9/9), 5 hpf ([I], n = 6/6), 5.5 hpf ([M], n = 19/19), or 6 hpf ([Q], n = 13/13). foxb1.2 expression in prospective neurectoderm in WT at 50% epiboly (B), or at 50% epiboly or shield stage immediately following HS at 4 hpf ([F], n = 3/3) or 5 hpf ([J], n = 9/9), respectively. foxb1.2 expression at 55%–60% epiboly following a 5.5 hpf HS ([N], n = 9/10), and at 65%–70% epiboly following a 6 hpf HS ([R], n = 15/15). AP-2 expression at 70% epiboly in ventral nonneural ectoderm in WT (C), and following HS at 4 hpf ([G], n = 13/13), 5 hpf ([K], n = 7/7), 5.5 hpf ([O], n = 7/7), or 6 hpf ([S], n = 8/8). dlx3 expression at 70% epiboly in ventral nonneural ectoderm in WT (D), and following HS at 4 hpf ([H], n = 12/12), 5 hpf ([L], n = 7/7), 5.5 hpf ([P], n = 8/10), or 6 hpf ([T], n = 12/16). gsc expression in dorsal midline mesoderm serves as a control for AP-2 and dlx-3, and is unaffected by HS.
Arrowheads denote expression domains. (D), (H), (L), (P), and (T) are lateral views, dorsal to right; all others are animal views, dorsal to right.
Reprinted from Developmental Cell, 14(1), Tucker, J.A., Mintzer, K.A., and Mullins, M.C., The BMP signaling gradient patterns dorsoventral tissues in a temporally progressive manner along the anteroposterior axis, 108-119, Copyright (2008) with permission from Elsevier. Full text @ Dev. Cell