
Image
|
Figure Caption
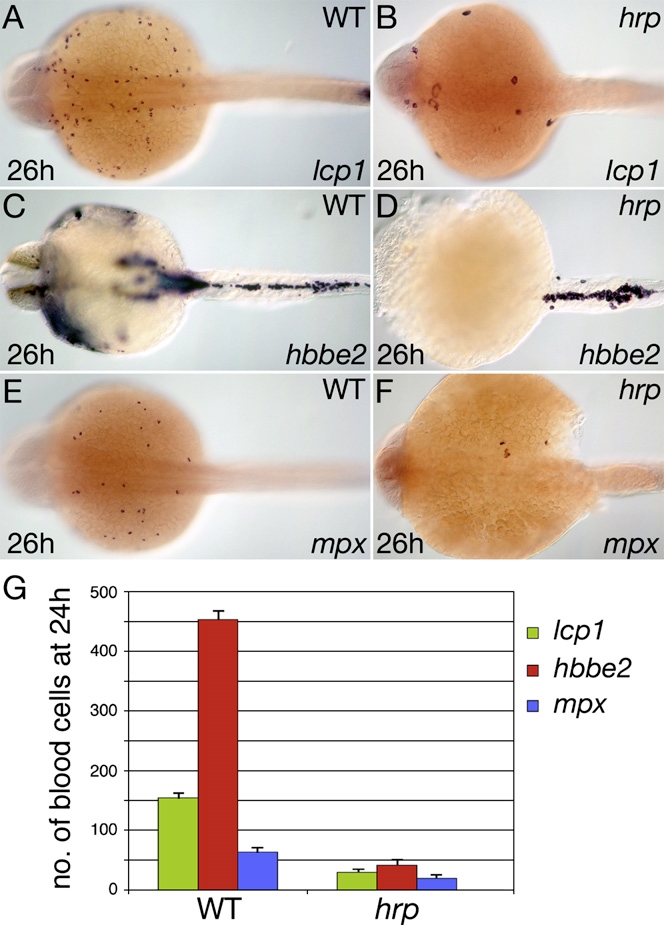
Fig. 5
Blood Formation in the Cell Cycle-Arrested Mutant harpy
(A–F) (A and B) Macrophage cells, (C and D) erythrocyte cells, and (E and F) neutrophil cells in wild-type and harpy (hrp) siblings. Note the super-sized cells in the hrp mutant.
(G) The approximate number of blood cells found at 24 hr. Error bars show SEM. For each blood type, a total of ten or more wild-type and mutant embryos were counted.
Figure Data
Acknowledgments
This image is the copyrighted work of the attributed author or publisher, and
ZFIN has permission only to display this image to its users.
Additional permissions should be obtained from the applicable author or publisher of the image.
Reprinted from Developmental Cell, 16(5), Warga, R.M., Kane, D.A., and Ho, R.K., Fate mapping embryonic blood in zebrafish: multi- and unipotential lineages are segregated at gastrulation, 744-755, Copyright (2009) with permission from Elsevier. Full text @ Dev. Cell