
|
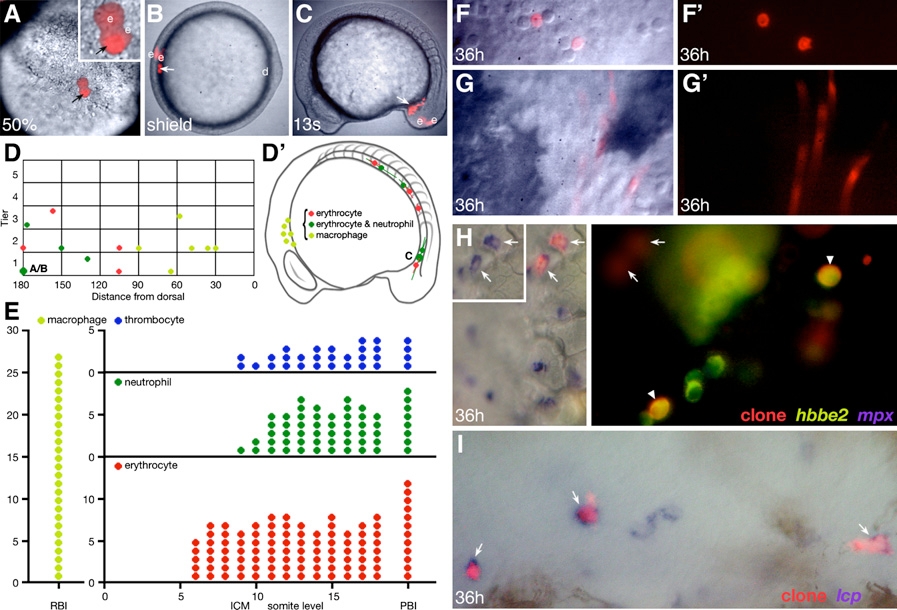
Fig. 2
Lineage Tracing and Fate Map Analysis of the Embryonic Blood
(A–G′) (A–C and F–G) Progeny of a single mid-blastula- labeled cell. (A) The clone at 50% epiboly (face view), now one deep cell (arrow) and two EVLs (e) at the margin of the blastoderm; note that the single deep cell is being viewed through one of the EVL cells. (B) The clone at the shield stage (animal pole view), now two deep cells (arrow) and two EVLs (e) located 180° of arc from the dorsal midline (d). (C) The clone at the 13-somite stage (side view), now 11 deep cells (arrow) in the posterior IMC. The EVL portion of the clone (e), now periderm, is extraembryonic. (F and G) The clone at 36 hr, now endothelial cells and circulating blood, which include (F) neutrophils and (G) erythrocytes. (D and D′) Hematopoietic fate maps. Graphs depict the location of the same clones at two different stages of development. (D) 6 hr gastrula fate map, clones versus dorsoventral location. The presentation is a side view; dorsal is oriented toward the right, with clones on the right projected to the left. Each symbol is the average location of the deep cell portion of a clone relative to the margin (tier 0), in units of cell diameter, and the dorsal midline (0), in degrees of arc. The oversized symbol represents the clone shown in (A)–(C), and the small letters refer to the respective panel. (D′) 16 hr 14-somite stage fate map, clones versus primitive blood island. The horizontal line through each symbol shows the anteroposterior spread of each clone. All clones except one also included endothelial cells. (E) 24 hr hematopoietic fate map, fate of clone versus anteroposterior location (RBI, somite level within the ICM, or PBI). Each symbol represents a single clone at that anteroposterior location; however, clones that spread over several somite levels are represented with multiple symbols. The fate map is based on 27 macrophage clones, 41 erythrocyte clones, 16 neutrophil clones, and 12 thrombocyte clones. These clones include all that were later verified by in situ hybridization.
(H and I) Verification of in vivo blood morphology by one- or two-color in situ hybridization at 36 hr. (H) A multilineage erythrocyte, neutrophil, and thrombocyte clone (red fluorescence) that was visualized for coexpression of hbbe2, an erythrocyte-specific marker (green fluorescence), and mpx, a neutrophil-specific marker (NBT/BCIP purple substrate). Left panel, the white-light image shows two lineage-labeled neutrophils (arrows). Inset, same cells showing mpx expression alone. Right panel, the UV image shows two lineage-labeled erythrocytes (arrowheads) and a clonally related thrombocyte (hbbe2-negative; right of upper erythrocyte). The neutrophil portion of the clone is out of focus (arrows). (I) A unilineage macrophage clone (red fluorescence) that was visualized for coexpression of lcp, a macrophage marker (NBT/BCIP purple substrate). The white-light image shows three lineage-labeled macrophages (arrows) and two macrophages not in the clone.
Reprinted from Developmental Cell, 16(5), Warga, R.M., Kane, D.A., and Ho, R.K., Fate mapping embryonic blood in zebrafish: multi- and unipotential lineages are segregated at gastrulation, 744-755, Copyright (2009) with permission from Elsevier. Full text @ Dev. Cell