
Fig. 3
- ID
- ZDB-IMAGE-090519-17
- Publication
- Kitambi et al., 2009 - Small molecule screen for compounds that affect vascular development in the zebrafish retina
- All Figures
- Figures for Kitambi et al., 2009
|
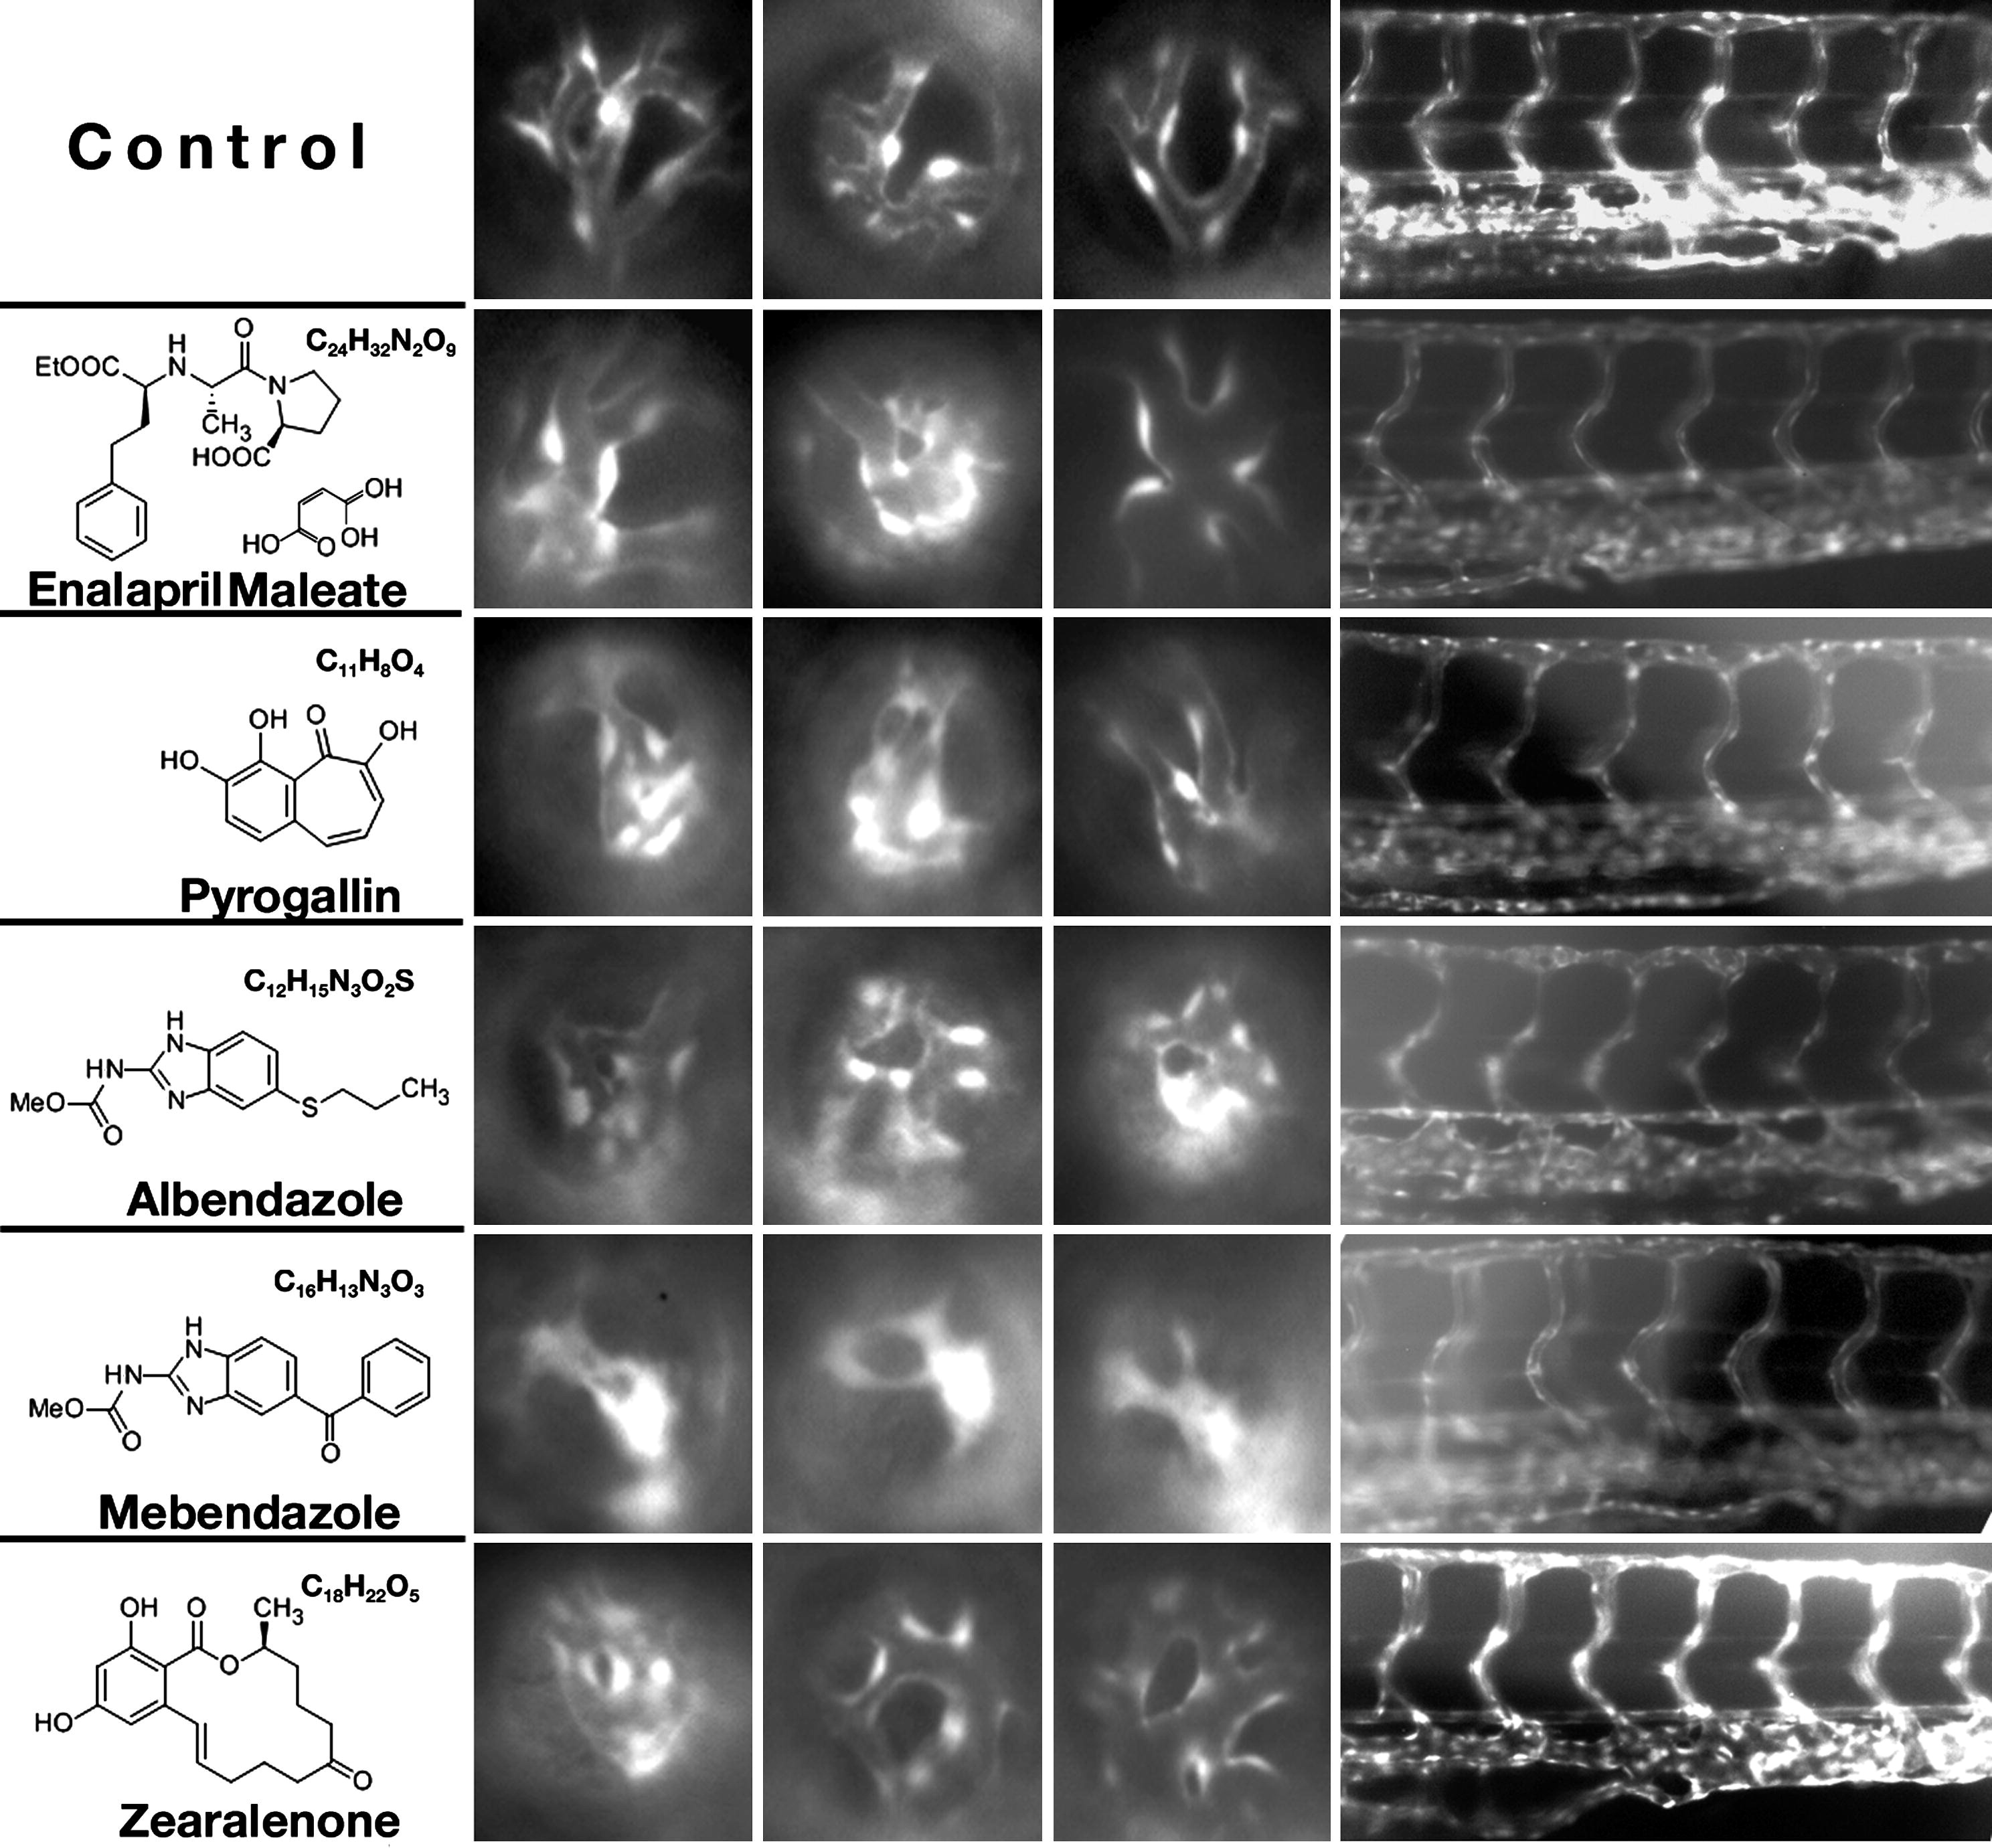
Fig. 3 Phenotypic changes in the retinal vasculature following treatment with different chemicals. Shown are lateral views of the retinal vasculature through the lens at 96 hpf (3 left-most columns of images), as well as lateral views of the trunk vasculature (right-most column of images, dorsal is up). Each row shows three examples of the phenotype induced in the retina and one example of trunk phenotype. Note that in the most extreme cases, vessels are not observed at all and GFP-positive tissue forms irregular clumps. Such clumps of tissue are not counted as vessel segments in graphs presented in Fig. 4. The name, formula, and the structure of each chemical are provided to the left of image panels.
Reprinted from Mechanisms of Development, 126(5-6), Kitambi, S.S., McCulloch, K.J., Peterson, R.T., and Malicki, J.J., Small molecule screen for compounds that affect vascular development in the zebrafish retina, 464-477, Copyright (2009) with permission from Elsevier. Full text @ Mech. Dev.