
|
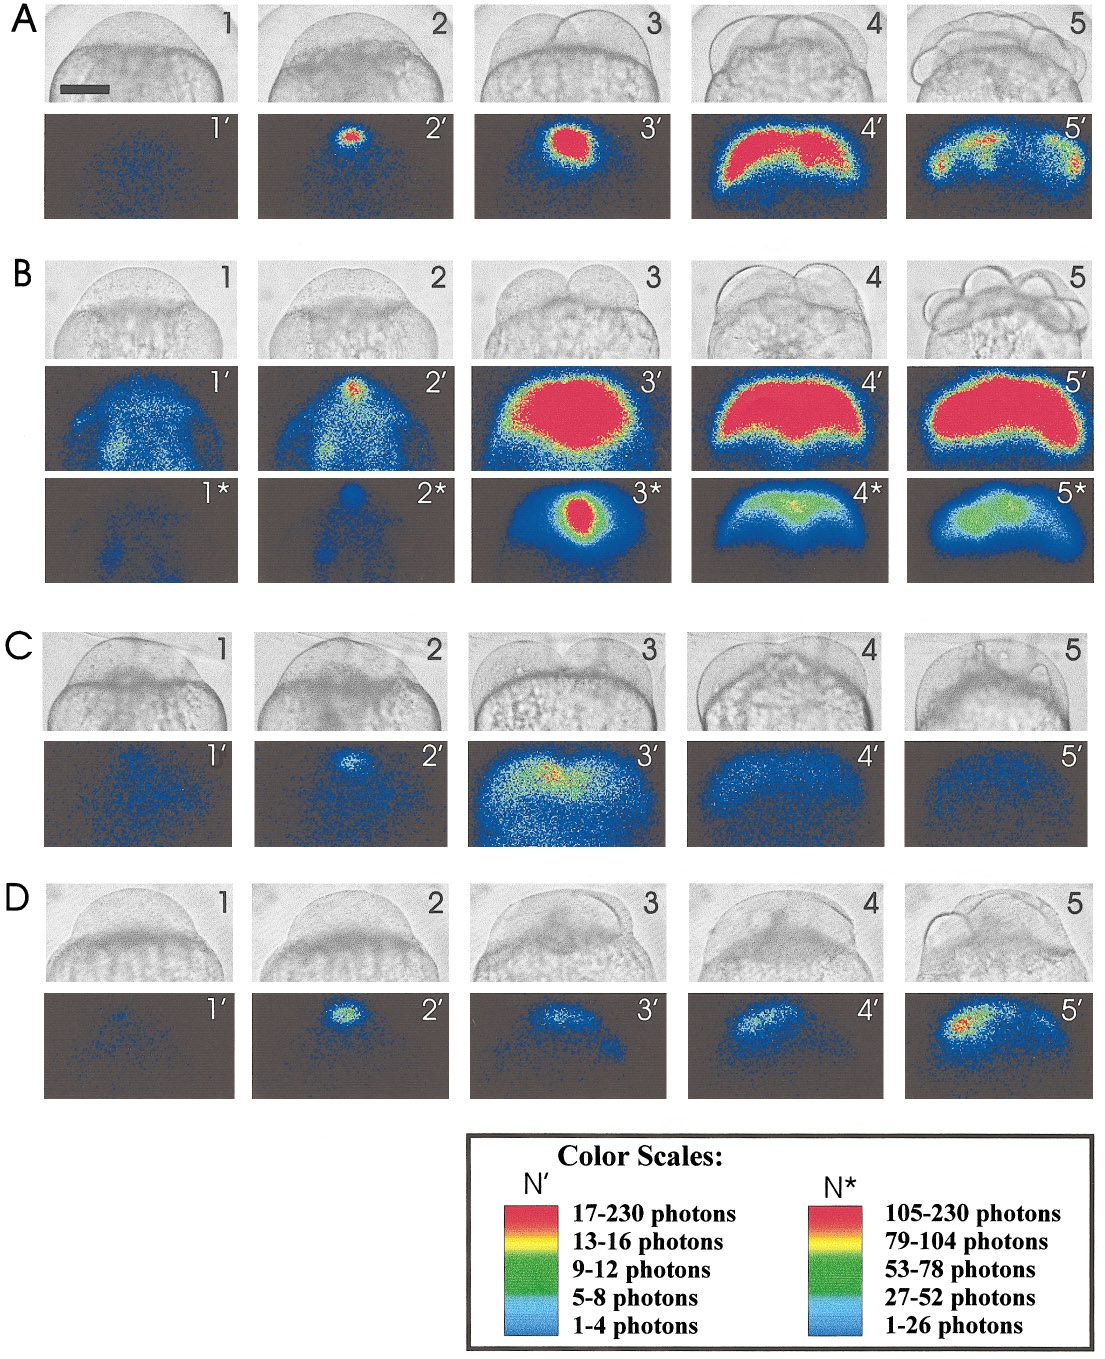
Fig. 4 Representative patterns of luminescence and corresponding bright-field images, from aequorin-loaded zebrafish eggs during the first 60 min after the onset of first cell division. Fertilized eggs were (A) raised under normal conditions, (B) bathed in Ca2+-free medium, or (C) injected with 5,5′-dibromo-BAPTA 1 min after the appearance of the positioning signal during the first cell division. (D) An example of a parthenogenetically activated egg. Each photon image represents 60 s of accumulated light. 1–5 indicate images obtained at the following time intervals: just prior to the first localized rise in intracellular calcium which accompanies the first appearance of the furrow arc (1), during this rise (2), and then 15 (3), 30 (4), and 60 (5) min following this initial rise, respectively. The maximum photon index was maintained at 20 for the N′ photon images, but was increased to 130 in the N′ panels to show that although the overall amount of calcium is elevated significantly, a relative localized elevation of calcium is still maintained. Scale bar is 200 μm.
Reprinted from Developmental Biology, 192, Webb, S.E., K.W. Lee, E. Karplus, and A.L. Miller, Localized calcium transients accompany furrow positioning, propagation, and deepening during the early cleavage period of zebrafish embryos, 78-92, Copyright (1997) with permission from Elsevier. Full text @ Dev. Biol.