
|
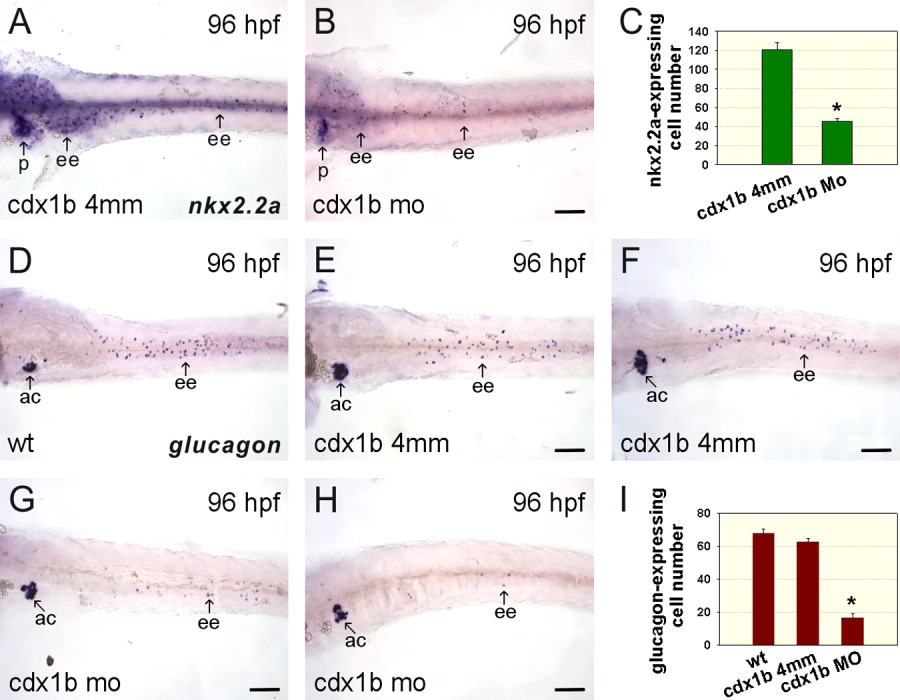
Fig. 4 Knockdown of cdx1b function affects the development of enteroendocrine cells in the intestine. A, B: cdx1b-4mm MO-injected (A) and cdx1b MO-injected (B) 96-hr post-fertilization (hpf) deyolked embryos hybridized with nkx2.2a antisense RNA probes. C: Comparison of nkx2.2a-expressing enteroendocrine cell numbers in cdx1b-4mm MO-injected (n = 21) and cdx1b MO-injected (n = 21) embryos. D-H: Wild type (D), cdx1b-4mm MO-injected (E, F), and cdx1b MO-injected (G, H) 96-hpf deyolked embryos hybridized with glucagon antisense RNA probes. I: Comparison of glucagon-expressing enteroendocrine cell numbers in wild type (n = 15), cdx1b-4mm MO-injected (n = 31), and cdx1b MO-injected (n = 29) embryos. Error bars indicate standard errors. Student's t-test was conducted to compare cdx1b MO-injected embryos with either wild type or cdx1b-4mm MO-injected embryos. *P < 0.001 in both comparisons. Ac, pancreatic α cells; ee, enteroendocrine cells; p, pancreas. Scale bars = 100 μm.