
Image
|
Figure Caption
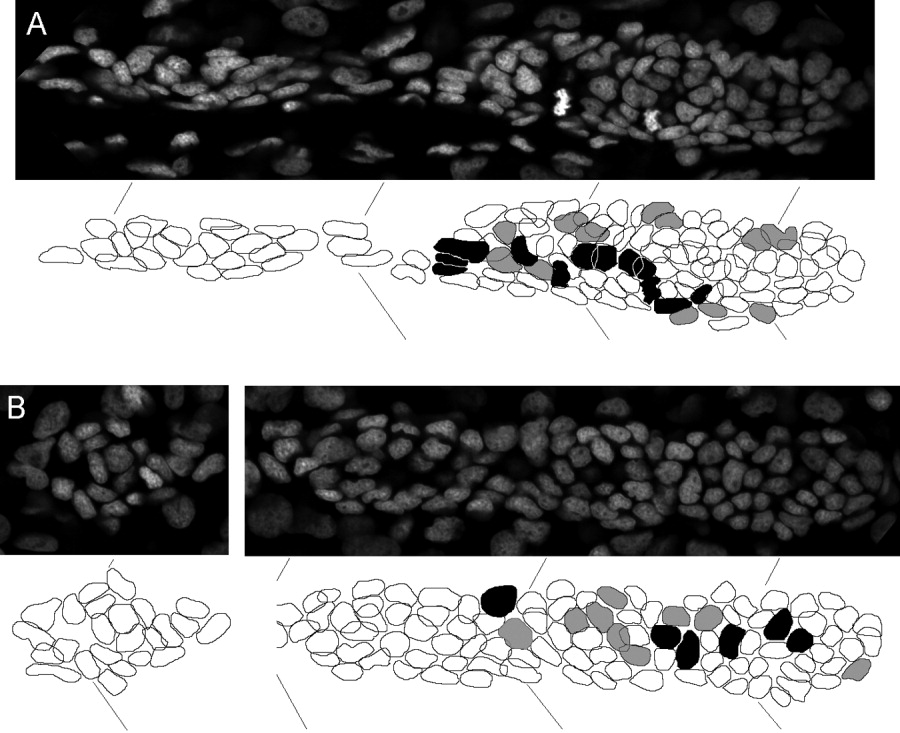
Fig. 4 Distribution of S and G2 phases. A: Distribution of cells in G2 (black) and S phase (gray) in a primordium that is one somite away from the last deposited neuromast, presumably corresponding to Vt/Vl = 0.8. B: Distribution of cells in G2 (black) and S phase (gray) in a primordium that is four somites away from the last deposited neuromast, presumably corresponding to Vt/Vl = 0.6.
Acknowledgments
This image is the copyrighted work of the attributed author or publisher, and
ZFIN has permission only to display this image to its users.
Additional permissions should be obtained from the applicable author or publisher of the image.
Full text @ Dev. Dyn.