
Image
|
Figure Caption
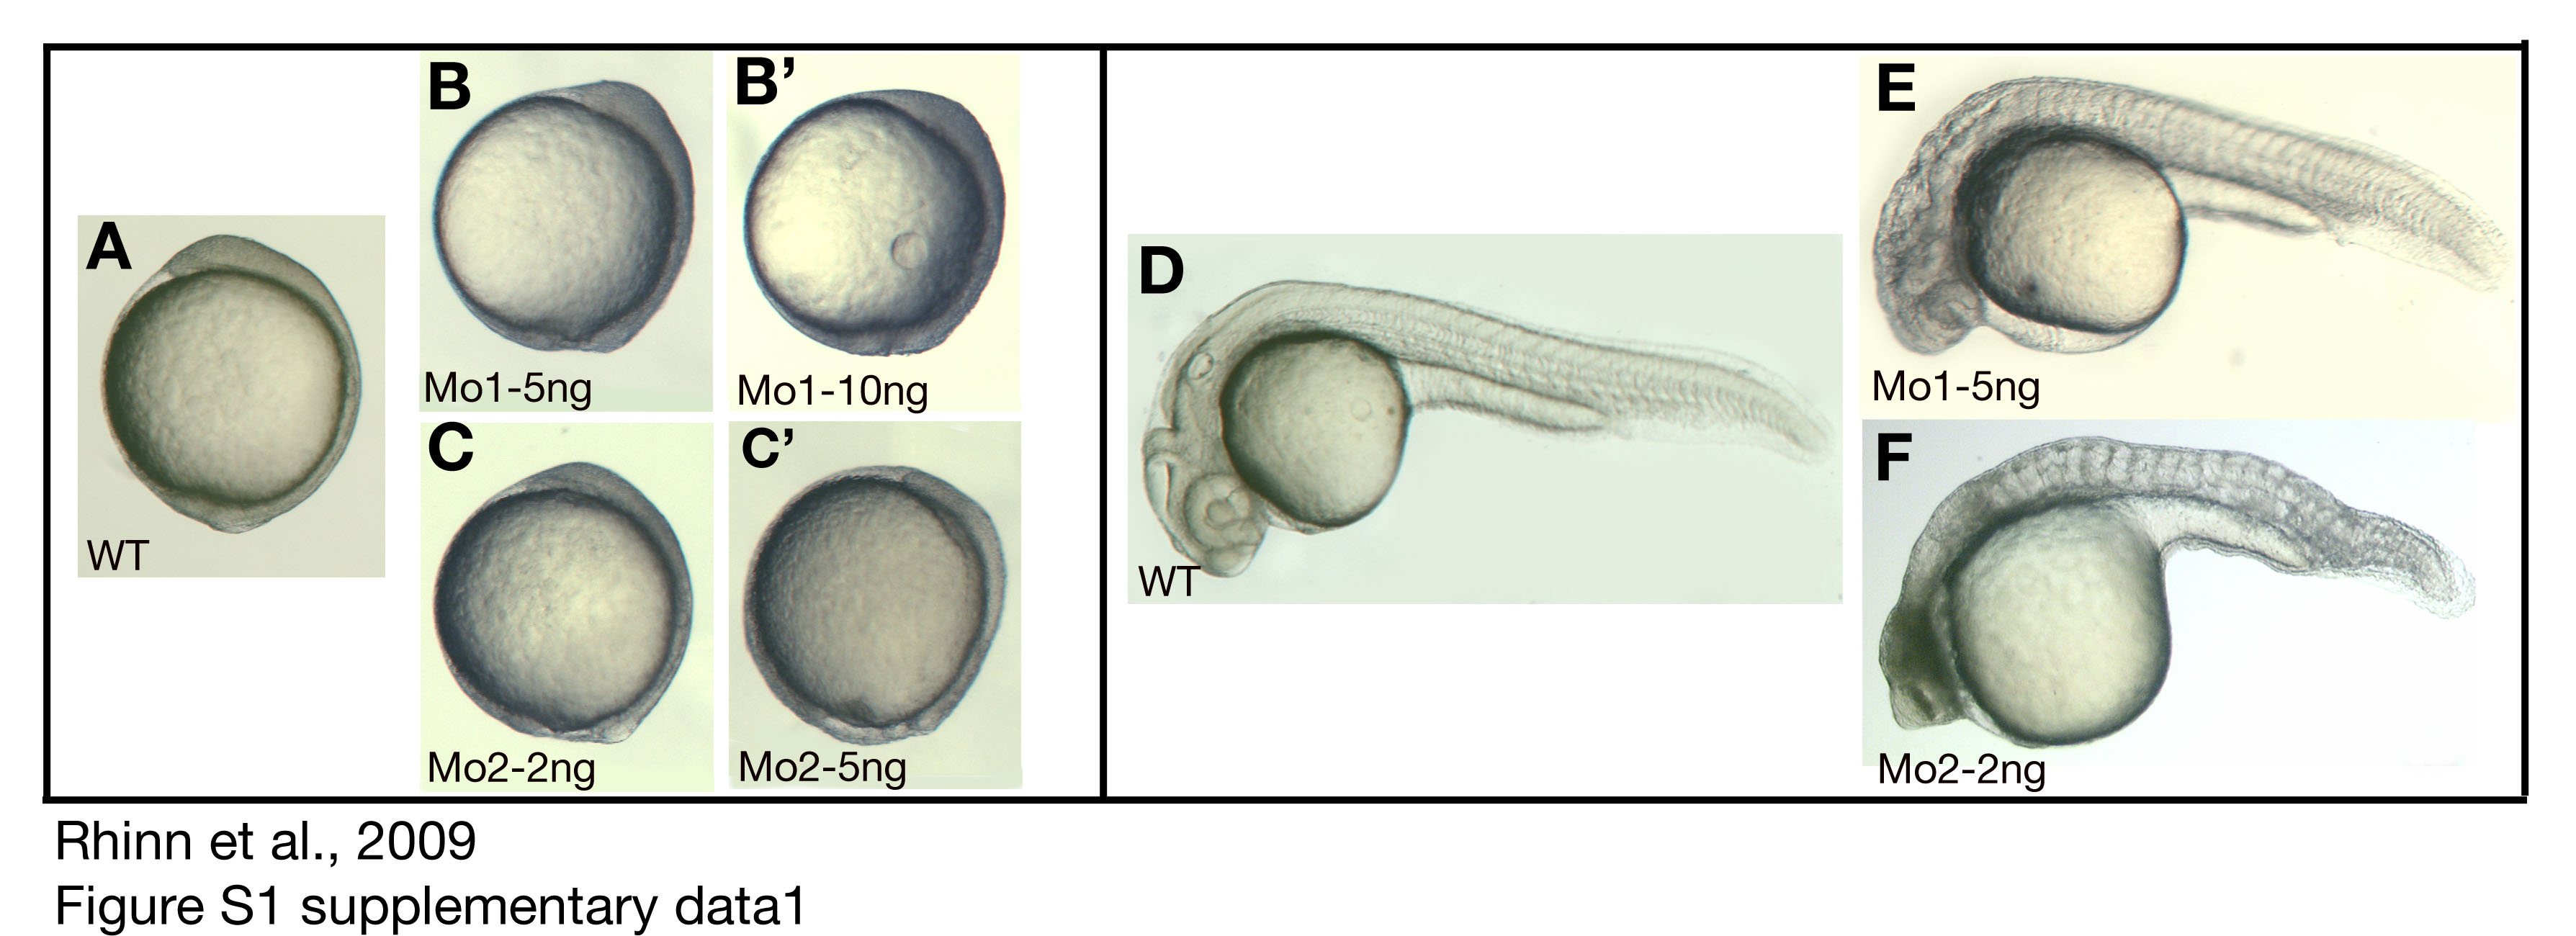
Fig. S1 Comparison of gbx1 Mo1 and Mo2 induced phenotypes. (A-F) Lateral views, anterior to the top (the tailbud stage) and to the left (24 h). (G-K′) Dorsal views, anterior to the top. (A) Control embryo at the tailbud stage; (B, B′) embryos at the tailbud stage injected with 5 ng and 10 ng Mo1 respectively; (C, C′) embryos at the tailbud stage injected with 5 ng and 10 ng Mo2 respectively. (D) Control embryo at 24 h; (E) 24 h embryo injected with 5 ng Mo1; (F) 24 h embryo injected with 5 ng Mo2.
Figure Data
Acknowledgments
This image is the copyrighted work of the attributed author or publisher, and
ZFIN has permission only to display this image to its users.
Additional permissions should be obtained from the applicable author or publisher of the image.
Full text @ Neural Dev.