
Image
|
Figure Caption
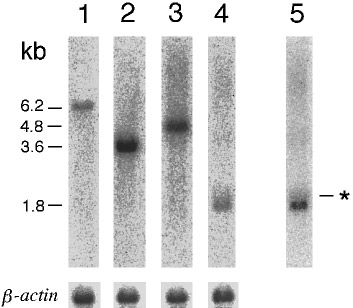
Fig. 3 Northern blot analyses of F-spondin1, F-spondin2, mindin1, and mindin2. Four micrograms of poly(A)+ RNA isolated from 28-h embryos was run in each lane. Lane 1, F-spondin1; lane 2, F-spondin2; lane 3, mindin1; and lanes 4 and 5, mindin2. Exposure time was the same in lanes 1-4. Lane 5 represents a sixfold-longer exposure of lane 4. Asterist indicates minor transcripts of mindin2, approximately 2.0-2.3kb in size. β-actin indicates patterns of rehybridization with a β-actin probe.
Figure Data
Acknowledgments
This image is the copyrighted work of the attributed author or publisher, and
ZFIN has permission only to display this image to its users.
Additional permissions should be obtained from the applicable author or publisher of the image.
Reprinted from Developmental Biology, 192, Higashijima, S., Nose, A., Eguchi, G., Hotta, Y., and Okamoto, H., Mindin/F-spondin family: novel ECM proteins expressed in the zebrafish embryonic axis, 211-227, Copyright (1997) with permission from Elsevier. Full text @ Dev. Biol.