
|
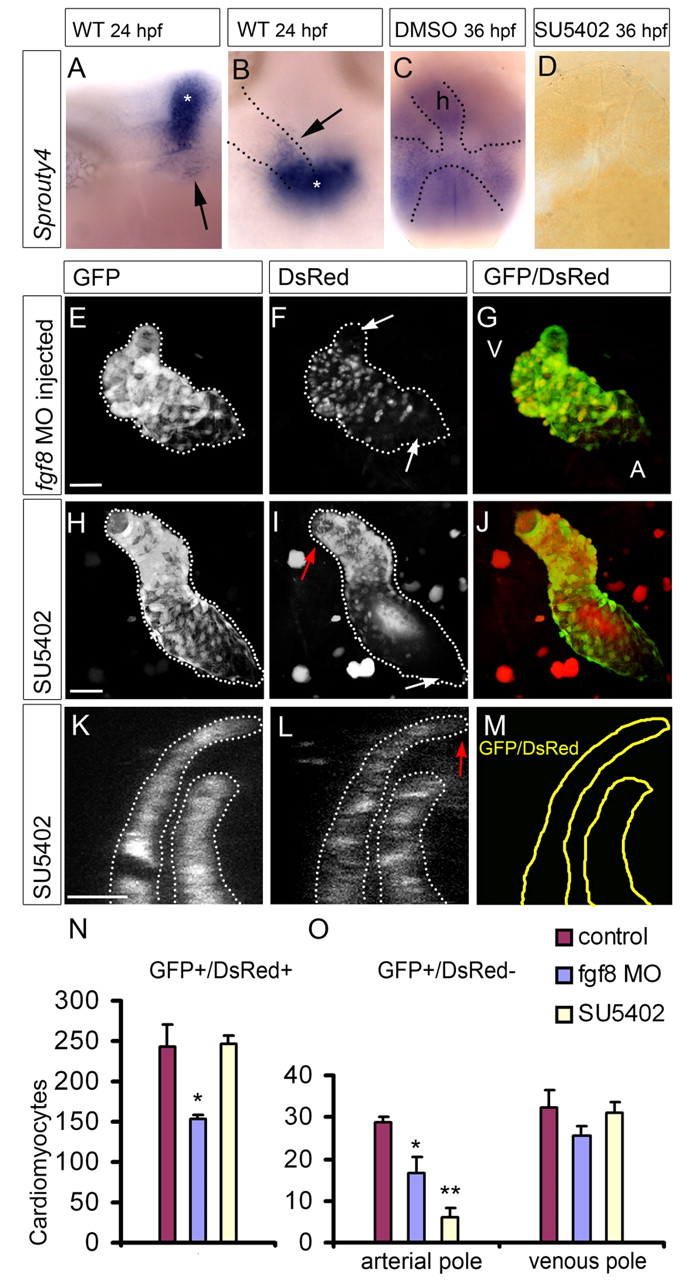
Fig. 6 Fgf signaling is required for the addition of cardiomyocytes to the arterial pole. (A-D) In situ hybridization for sprouty4 (spry4). (A,B) Lateral (A) and dorsal (B) view of a 24 hpf embryo. The arrows indicate the region of spry4 expression near the arterial pole of the heart tube, which could contribute cells to the heart tube. The asterisk indicates the midbrain-hindbrain boundary. In B the heart tube is indicated by the dotted line. (C,D) Dorsal views of 36 hpf embryos that had been treated from 24 hpf until 36 hpf with DMSO (C) or SU5402 (D); spry4 expression in the DMSO-treated embryo is outlined by the dotted line. (E-J) Images of the developmental timing assay (similar to Fig. 2A-I). The arterial pole is at the top left. V, ventricle; A, atrium. The dotted line outlines the eGFP-positive heart tubes. Scale bars: 50 μm. (E-G) A representative fgf8 MO-injected embryo showing reduced heart size. The white arrows indicate the eGFPposDsRedneg cells at the poles of the heart. (H-J) A representative embryo treated with SU5402 from 24-48 hpf. The red arrow indicates the arterial pole, in which eGFPposDsRedneg are absent; the white arrow indicates the eGFPposDsRedneg cells at the venous pole. The peripheral red dots are background signal from yolk granules; the diffuse red signal within the heart tube is due to background fluorescence of red blood cells accumulated within the heart lumen. (K,L) Single z-scan of a confocal image taken from a Tg(cmlc2:eGFP)/Tg(cmlc2:dsred2-nuc) embryo treated with SU5402 from 24-48 hpf. A complete overlap of the eGFP (K) and DsRed (L) signals at the distal tip of the outflow (red arrow) was observed, in contrast to the control embryos represented in Fig. 2J,K. Scale bar: 25 μm. (M) Schematic of the location of the eGFPposDsRedpos cells after SU5402 treatment. (N,O) The number of eGFPposDsRedpos (N) and eGFPposDsRedneg (O) cardiomyocytes/embryo. (O) The eGFPposDsRedneg cardiomyocytes are subdivided into those present at the arterial pole and those present at the venous pole. Bars represent mean±s.e.m. Note the reduction in the number of eGFPposDsRedneg cells located at the arterial pole after fgf8 MO-injection or SU5402 treatment. *P<0.05; **P<0.01.