
|
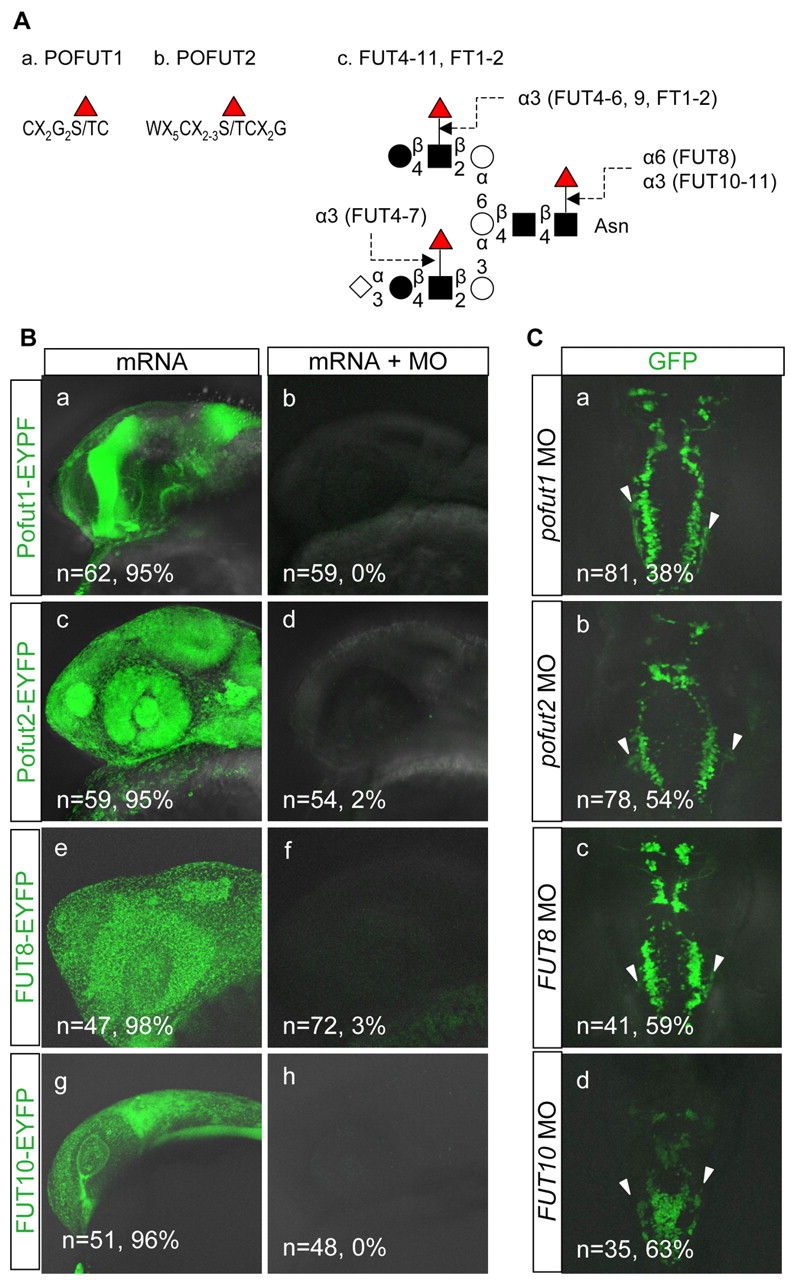
Fig. 8 Repression of FUT7-9, FT1, FT2, POFUT1 and POFUT 2 does not phenocopy twdrw685 mutant. (A) Schematic diagram showing the fucosylation sites for POFUT1 (a), POFUT2 (b), FUT4-11 and FT1-2 (c). Red triangle, fucose; diamond, sialic acid; filled circle, galactose; square, GlcNAc; open circle, mannose. (B) (a,c,e,g) Wild-type embryos injected with the mRNAs only; (b,d,f,h) wild-type embryos injected with the mRNAs plus the MOs against the mRNAs. Lateral view at 24 hpf, rostral towards the left. The numbers of embryos examined and the percentage of EYPF-positive embryos are given in the individual pictures. (C) Dorsal view of pofut1 (a), pofut2 (b), FUT8 (c) and FUT10 (d) morphants at 50 hpf (rostral to the top). The numbers of morphants examined and the percentage of morphants with aberrant positioning of the vagus motor neurons lateral to the vagus motor nuclei (a-c, arrowheads) or with fusion of the bilateral vagus motor nuclei (d) are given in the individual pictures. In some FUT10 morphants, aberrant positioning of the vagus motor neurons lateral to the vagus motor nuclei was also observed (d, arrowheads).