
|
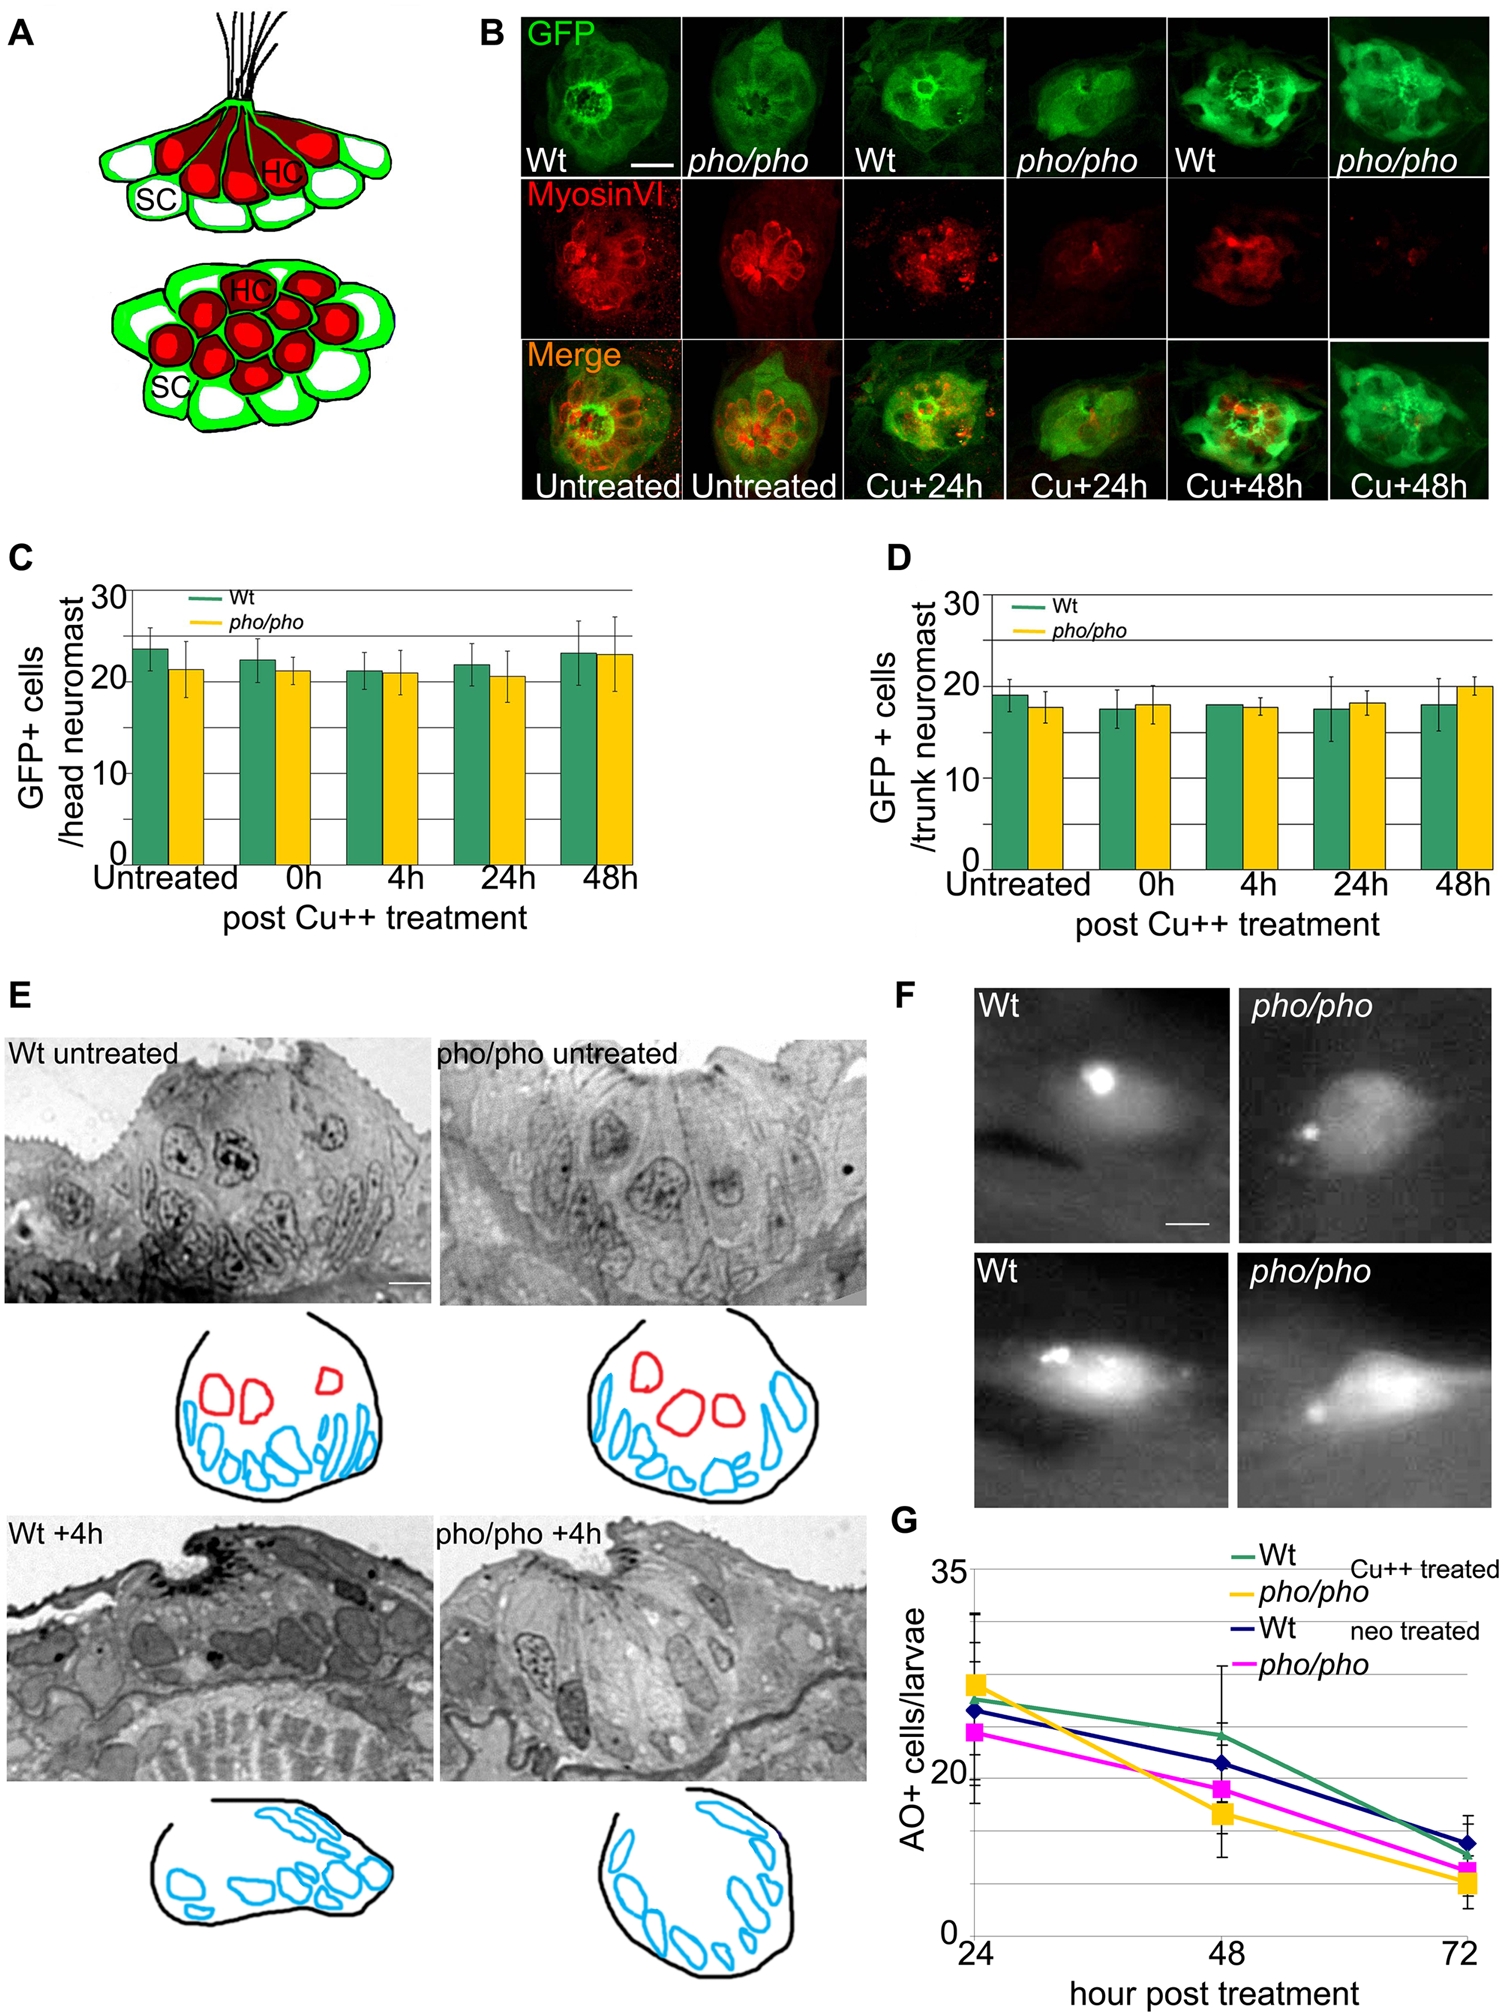
Fig. 4 Supporting cells are present and do not die at a higher rate because of the treatments in the phoenix mutant neuromasts.
(A) Schematic drawings of a side view (top panel) and a dorsal view (bottom panel) of a neuromast, illustrating the distribution of the two cell types. The hair cells (red) are centrally located and engulfed in a thin cytoplasmic furrow projected apically by the underlying supporting cells (green). (B) Immuno-labeled neuromasts with an antibody against GFP (top panels) staining the supporting cells and an antibody against Myosin VI (middle panels) staining the hair cells. Merged images are presented in the bottom panels. The SCM1 transgenic line, which we crossed into the phoenix mutant background, is expressing GFP exclusively in the supporting cells of the lateral line. We imaged transgenic wild-type (from the left, columns 1, 3, and 5) and transgenic phoenix mutant (columns 2, 4, and 6) larvae. Columns 1 and 2 are untreated 5dpf larvae. Columns 3 and 4 are larvae 24h post copper treatment. Columns 5 and 6 are larvae 48h post copper treatment. (C) Quantification of the number of GFP positive supporting cells respectively, in untreated (n = 18/21) and in +0h (n = 12/9), +4h (n = 15/17), +24h (n = 15/12), and +48h (n = 15/18) post copper treated transgenic wild-type (green bars) and transgenic phoenix mutant (yellow bars) head neuromasts. (D) Trunk neuromasts in wild-type and phoenix mutant transgenic larvae have been counted at the same stages, respectively untreated (n = 3/4), +0h (n = 4/3), +4h (n = 1/4), +24h (n = 2/5), and +48h (n = 2/3). (E) Semi-thin sections through wild-type (left panels) and mutant (right panels) neuromasts in untreated (top panels) and + 4h post neomycin treated (lower panel) 5dpf larvae. We used between 13 and 20 successive sections to reconstruct each wild-type and mutant neuromast (n = 1/2 untreated, n = 6/6 at +4h, respectively). We show one representative wild-type and mutant section at each stage. Under each section, a camera lucida sketch is showing the limits of the neuromast and the outlines of the nuclei (red for hair cells, blue for supporting cells). (F) Live images of two wild-type (left panels) and two mutant (right panels) neuromasts after AO stainings in larvae, 24h post copper treatment. (G) Scoring of the number of acridine orange (AO) positive cells in the lateral line/larvae, 24, 48, and 72h post copper (Cu++) or neomycin (neo) treatments. For the copper treatment, we monitored wild-type (green line) and mutant (yellow line, n = 22/13 at +24h, n = 14/12 at +48h, and n = 18/6 at +72h, respectively) larvae. For the neomycin treatment, we monitored wild-type (blue line) and mutant (pink line, n = 12/10 at +24h, n = 11/14 at +48h, and n = 10/11 at +72h, respectively) larvae. – 10 microns in (B) and (F) and 5 microns in (E).