
Image
|
Figure Caption
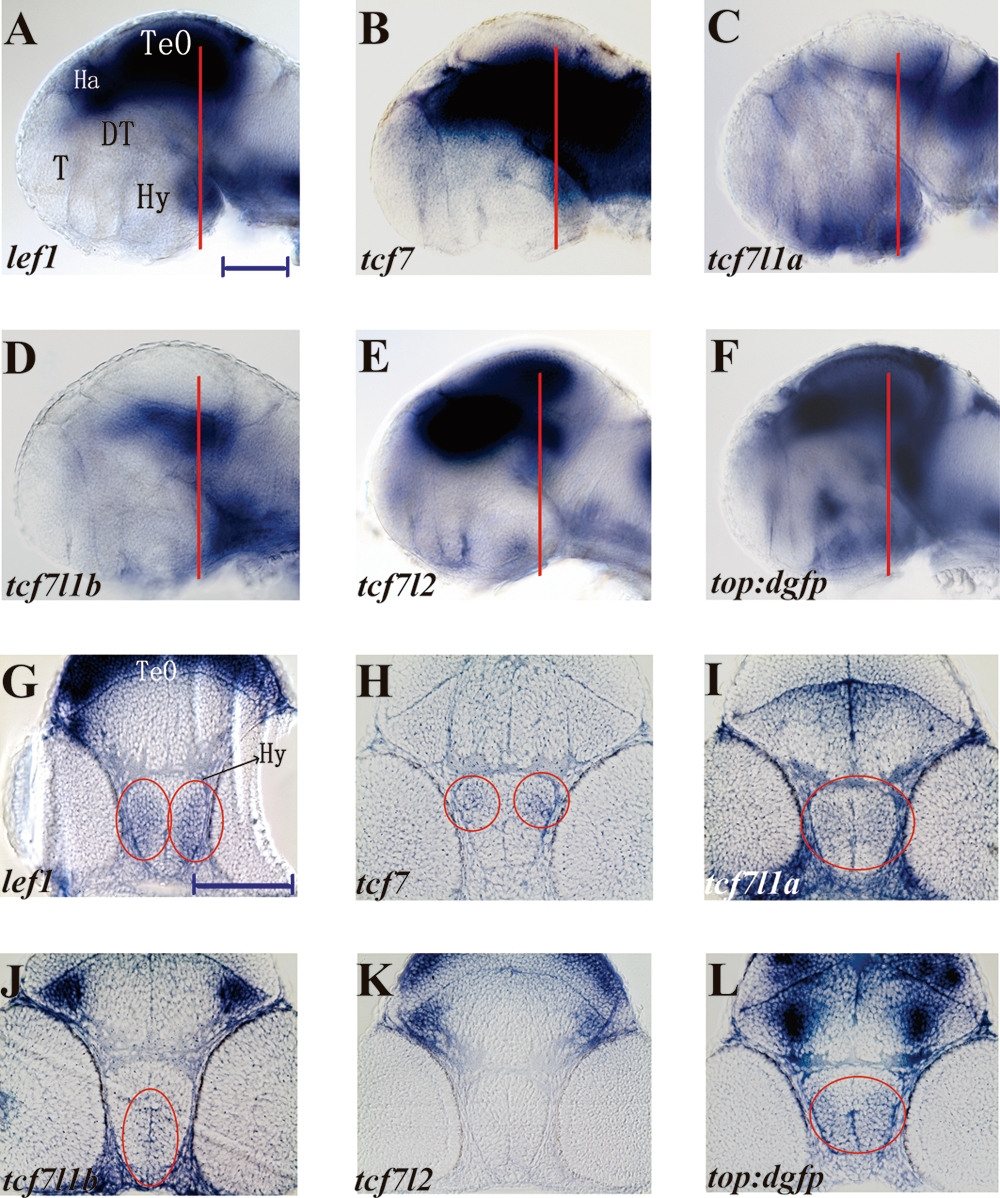
Fig. 1 Expression of tcf and top:dgfp mRNA in the 50 hpf embryonic zebrafish hypothalamus. (A–F) Lateral views of whole-mount brains at 50 hpf. (G–L) Ten-micron plastic cross sections of the posterior hypothalamus. Sectioned regions are indicated in panels (A–F). Circled regions in (G–L) indicate domains of specific gene expression. top:dgfp and all tcf genes except tcf7l2 are expressed in the posterior hypothalamus. T, telencephalon; Ha, habenula; TeO, tectum opticum; DT, dorsal thalamus (thalamus); Hy, hypothalamus. Scale bars: 100 μm.
Acknowledgments
This image is the copyrighted work of the attributed author or publisher, and
ZFIN has permission only to display this image to its users.
Additional permissions should be obtained from the applicable author or publisher of the image.
Full text @ Zebrafish