
|
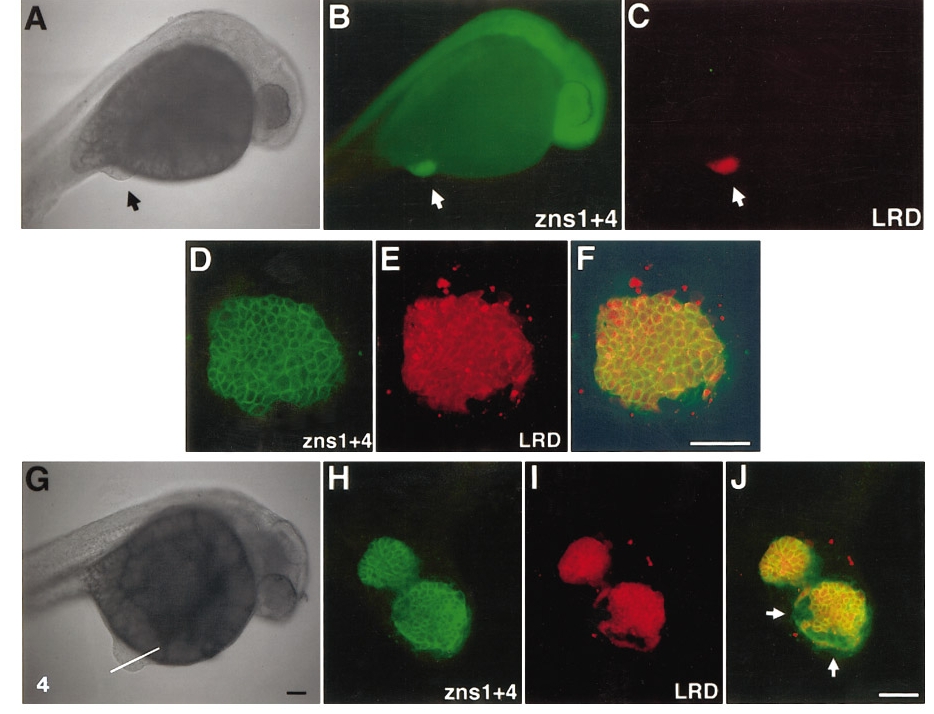
Fig. 4 80H cells express neural markers ectopically. (A–C) An embryo with an 80H graft at the lower abdomen region (arrows) viewed in brightfield (A) and after labeling with zns1 and zns4 antibodies (B). These neural-specific antibodies labeled the host’s neural axis (B), as well as the graft, visualized with lineage tracer (LRD; C). (D–F) High-magnification confocal image of the graft seen labeled with rhodamine dextran (E) and zns antibodies (FITC-labeled; D). An overlay of the two (F) shows that all the grafted cells (LRD-positive) are positive for these neural-specific antibodies. (G–J) An example of 80H graft in which host tissue close to the graft also expressed neural antibody, offering evidence of homeogenetic induction. Brightfield image of the host (G) indicating the optical section plane for the confocal images (H–J). In this embryo, the 80H graft (I) had segregated into two parts, interposed with host-derived tissue. Zns1 + 4 antibody revealed cells that were green but not red, indicating that these host-derived cells have adopted neural fate (H, composite image in J). Scale bars: A and G, 100 μm; F and J, 50 μm.
Reprinted from Developmental Biology, 197, Woo, K. and Fraser, S.E., Specification of the hindbrain fate in the zebrafish, 283-296, Copyright (1998) with permission from Elsevier. Full text @ Dev. Biol.