
|
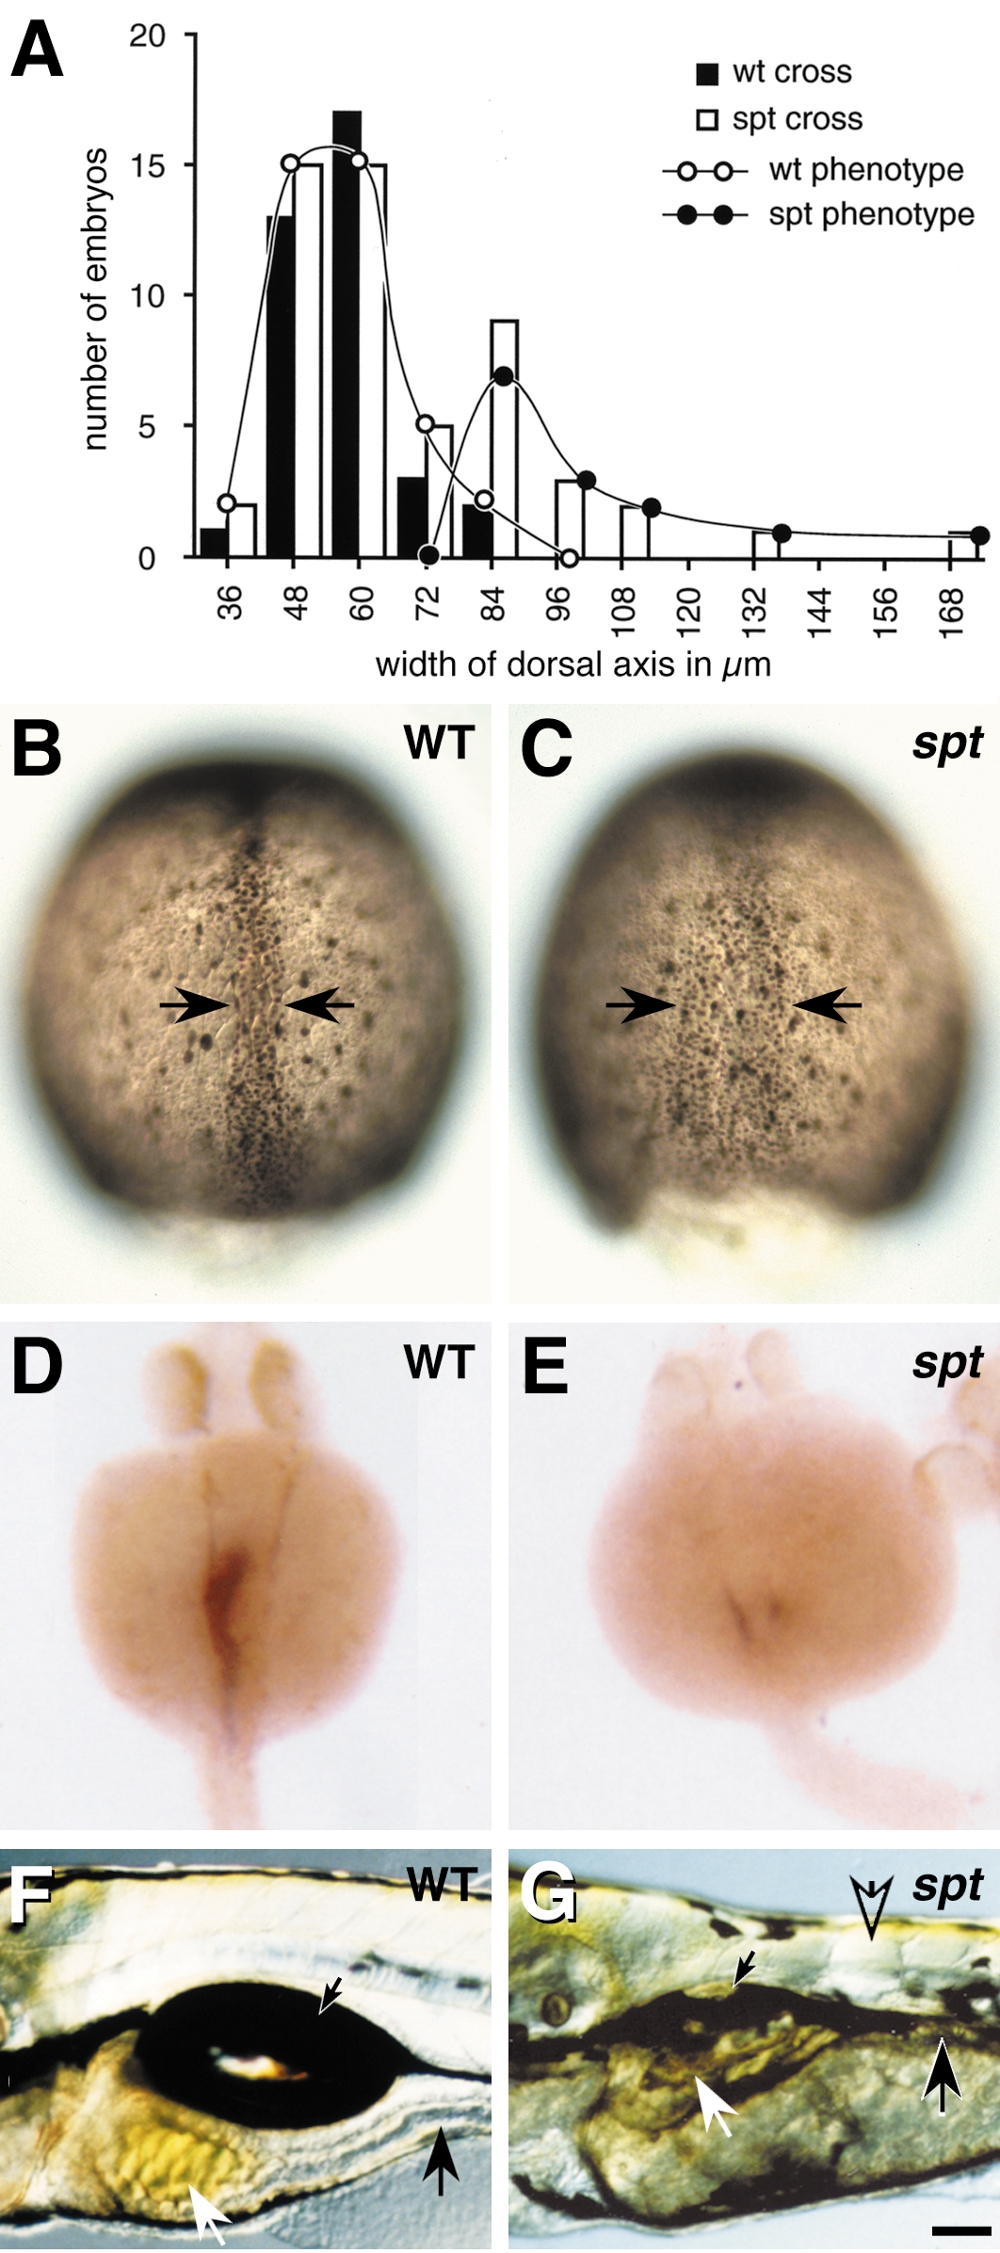
Fig. 3 There are more axial and less paraxial cells in spadetail mutants. (A) The bimodal distribution in the width of the dorsal axis for embryos derived from a cross of spadetail heterozygotes (open bars), and the bell curve for embryos derived from a cross of wildtype homozygotes (solid bars). Overlap is apparent between the larger peak in the spadetail cross and the wildtype peak, suggesting that embryos within this region of the graph are phenotypically wildtype. The smaller peak in the spadetail cross would represent mutant embryos. Black lines with open or closed circles are the inferred distribution based on the expected mutant frequency. Axis were measured on a dissection scope using an ocular micrometer. (B and C) Dorsal axis (arrows) visualized using anti-Fkd2 immunostaining at 80% epiboly. (B) Representative wildtype embryo. (C) Presumed mutant embryo. (D and E) The embryonic gut in 1-day embryos visualized using fkd2 RNA expression (Odenthal and Nüsslein-Volhard, 1998). (F and G) The differentiated gut in 5 day embryos, the stomach (white arrow), intestine (black arrow), and swimbladder (small black arrow), all derived from the paraxial region (Warga and Nüsslein-Volhard, submitted) are present, but diminutive in the mutant. Note that muscle is now apparent, but less abundant in the mutant trunk as revealed by birefringence (open arrow). Scale bar: 60 μm (B and C), 100 μm (D–G).
Reprinted from Developmental Biology, 203, Warga, R.M. and Nüsslein-Volhard, C., Spadetail-dependent cell compaction of the dorsal zebrafish blastula, 116-121, Copyright (1998) with permission from Elsevier. Full text @ Dev. Biol.