Image


                        Figure Caption


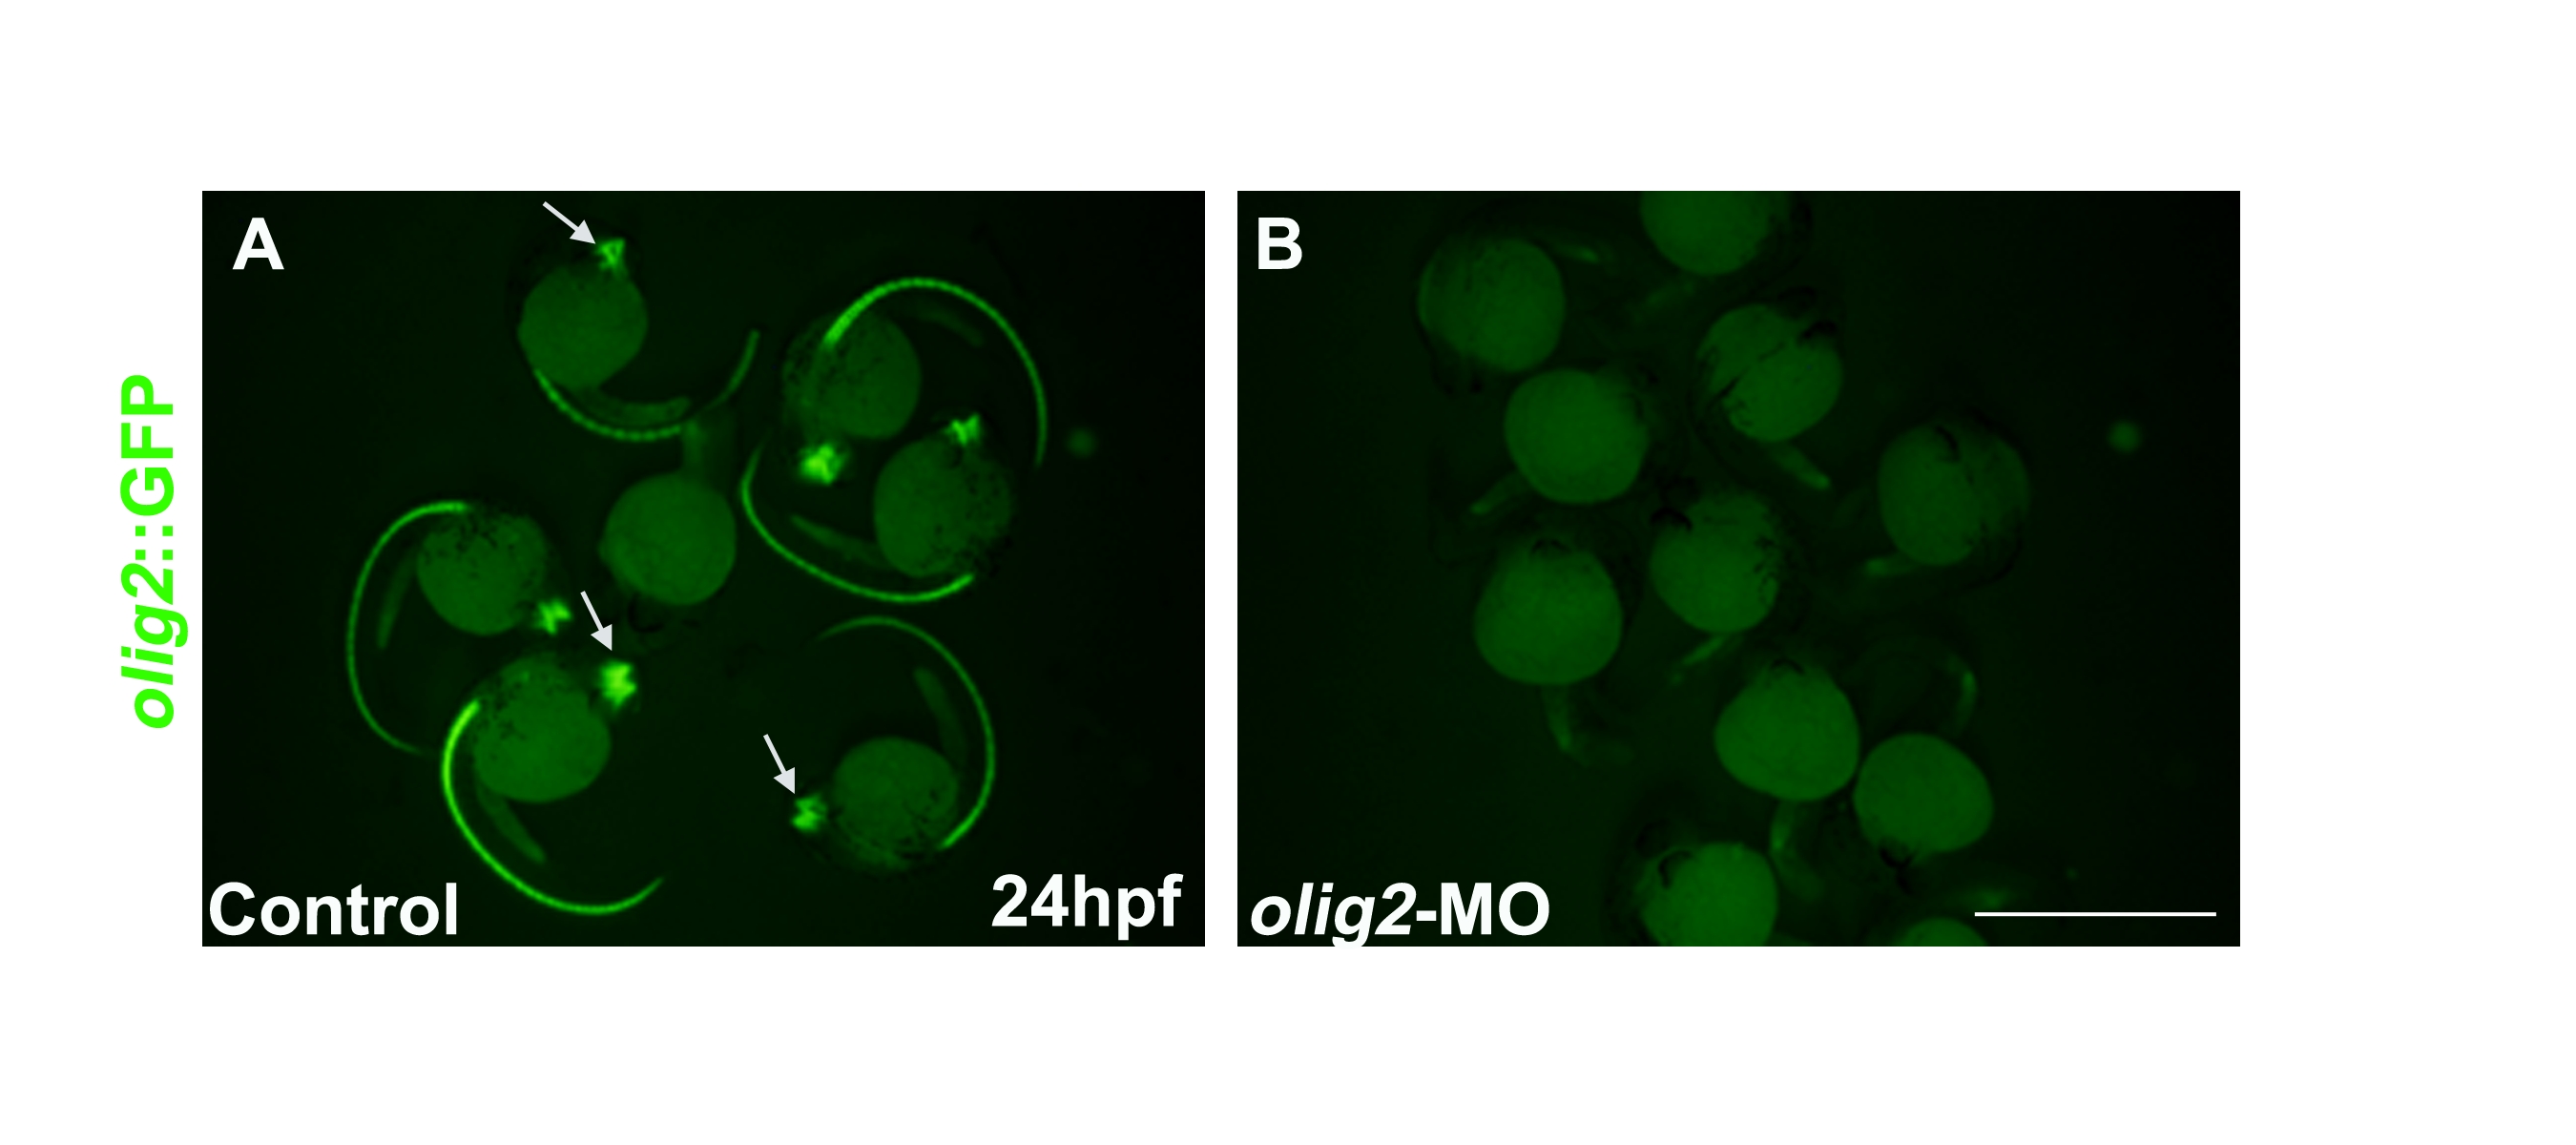
Fig. S3 Effects of Olig2ATG-directed morpholino (MO). Fluorescent images of (A) control and (B) Olig2 MO injected Olig2::GFP transgenic live embryos at 24 hours post fertilization (hpf). Strong GFP expression is detected in the control embryos (white arrows) while no GFP is found in the MO injected embryos. Note that the contrast was artificially enhanced in image displaying MO injected embryos (panel B) to compensate for complete lack of fluorescence. Scale bar: 200 μm.
                
                    
                        Acknowledgments


This image is the copyrighted work of the attributed author or publisher, and
ZFIN has permission only to display this image to its users.
Additional permissions should be obtained from the applicable author or publisher of the image.
      Full text @ Dev. Dyn.


        