
|
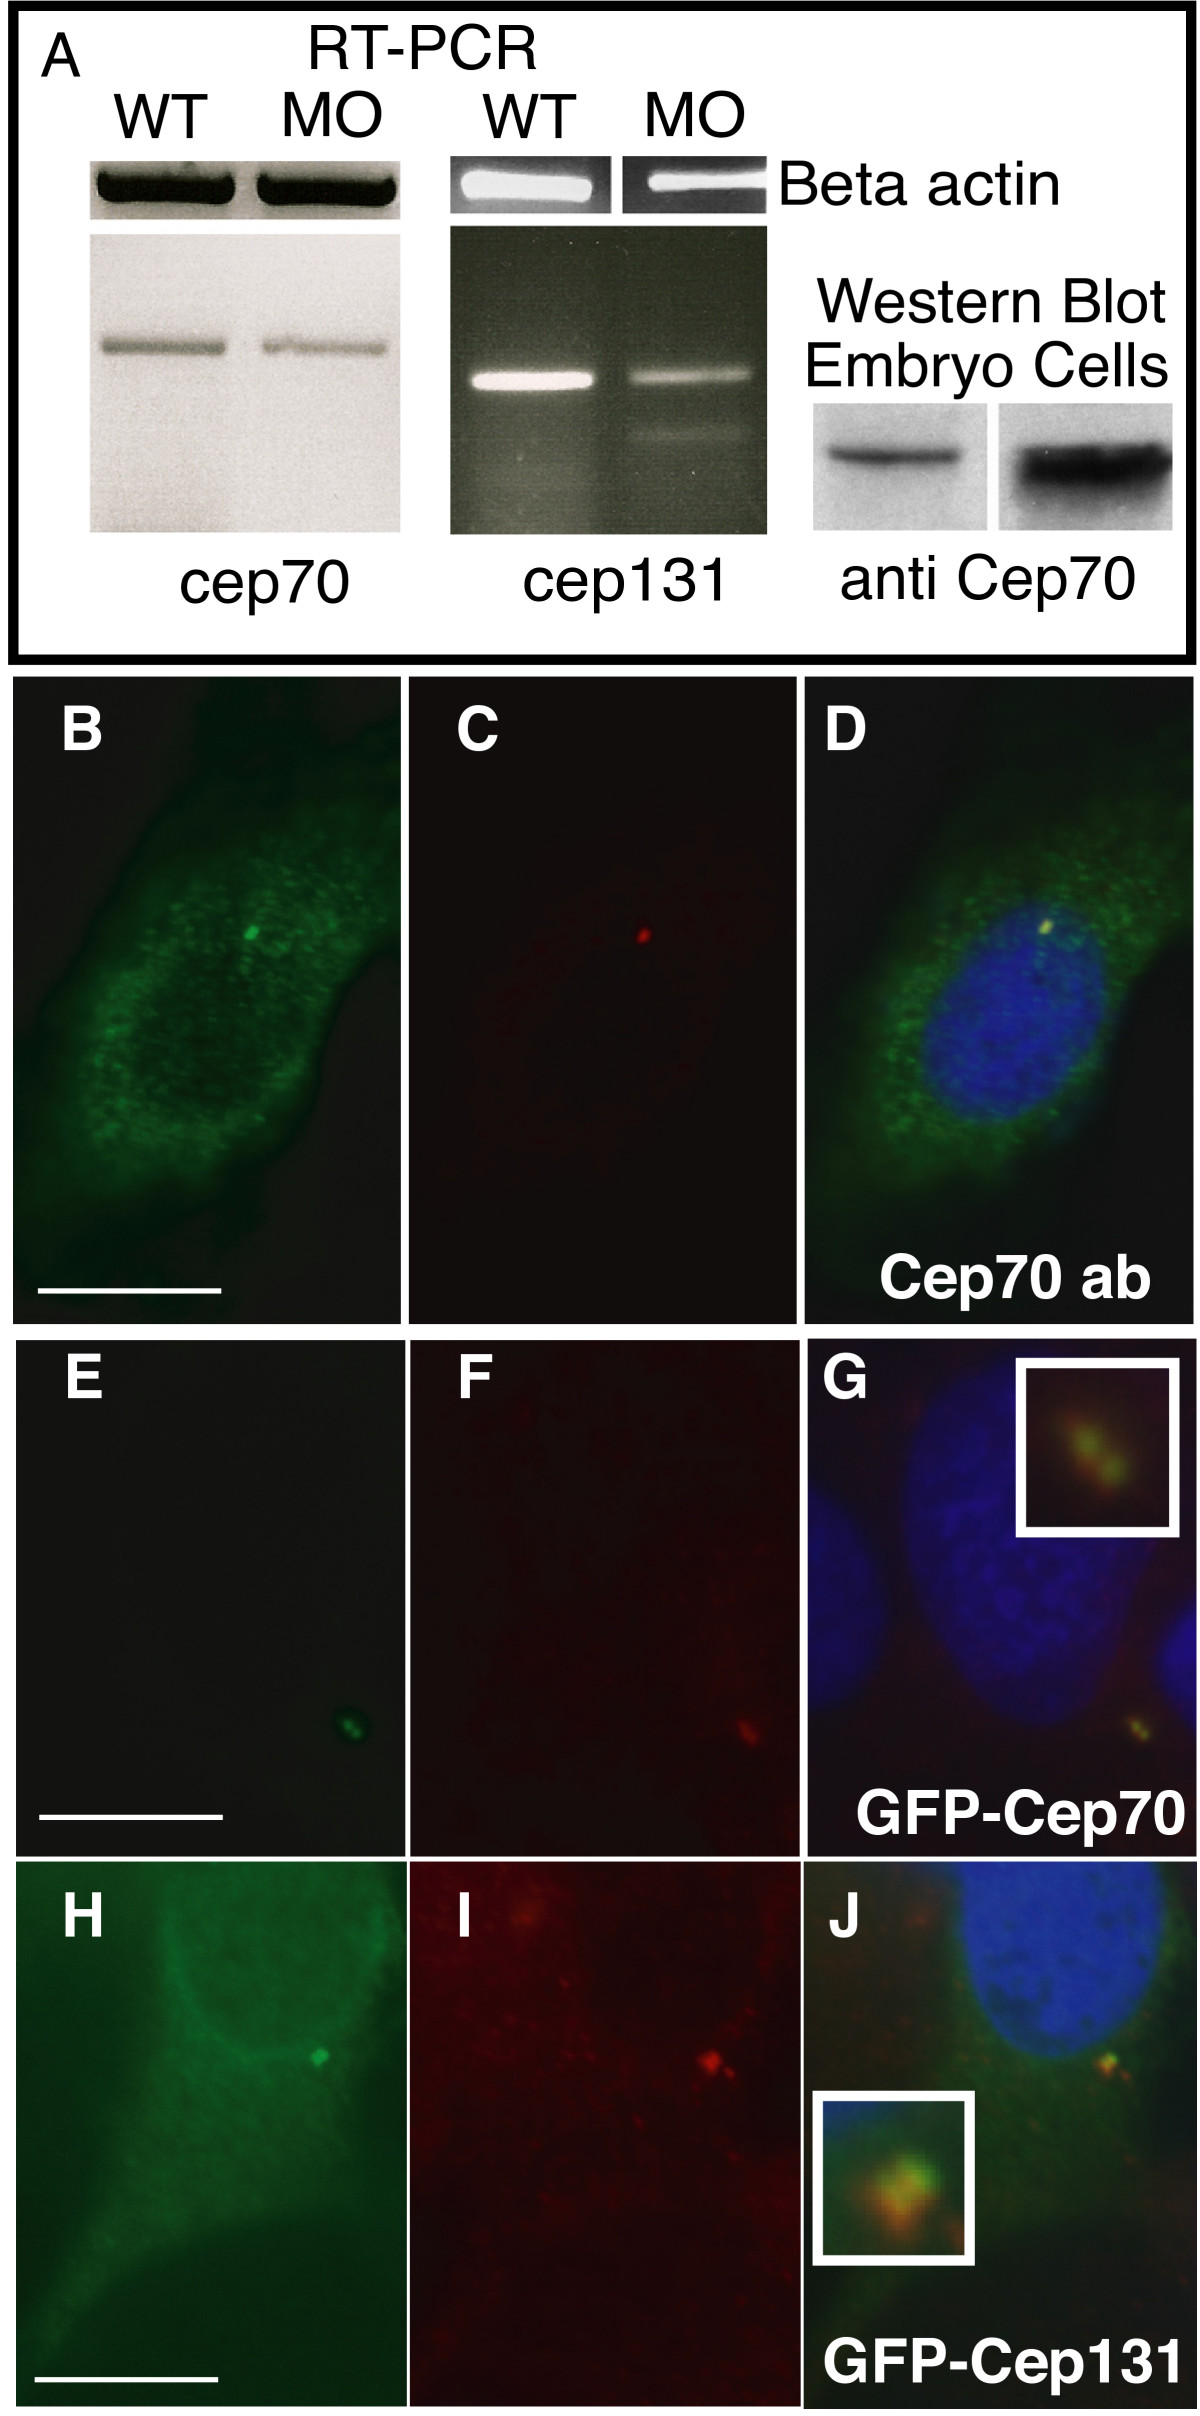
Fig. 2 Subcellular localisation of Cep70 and Cep131. (A) Splicing-inhibitory morpholinos result in a reduction in cep70 and cep131 mRNA levels, as judged by RT-PCR of a 480 bp or a 360 bp fragment, respectively, that covers the splice site. In the cep131 morphant, an additional, faint band at 260 bp can be observed. This is consistent with skipping of the third exon, though other splicing products might also be possible. Right, an antibody to Cep70 recognises a 70 kDa band in PC2 cell line and zebrafish embryo extract. (B-J) Subcellular localisation of Cep70 and Cep131. An antibody raised to Cep70 gives a punctate staining (B) similar to gamma tubulin (C) in PC2 zebrafish cultured fibroblasts. The two signals coincide when the two channels are merged, the centrosome now shown in yellow (D). GFP-Cep70 and GFP-Cep131 localise to the centrosome, as expected (E-J). Cep70 or GFP fusions are shown in green, gamma tubulin is in red, nuclei are in blue (DAPI) in merged pictures. Insets enlarge the centrosome signal. Scale bar: 10 μm.