
|
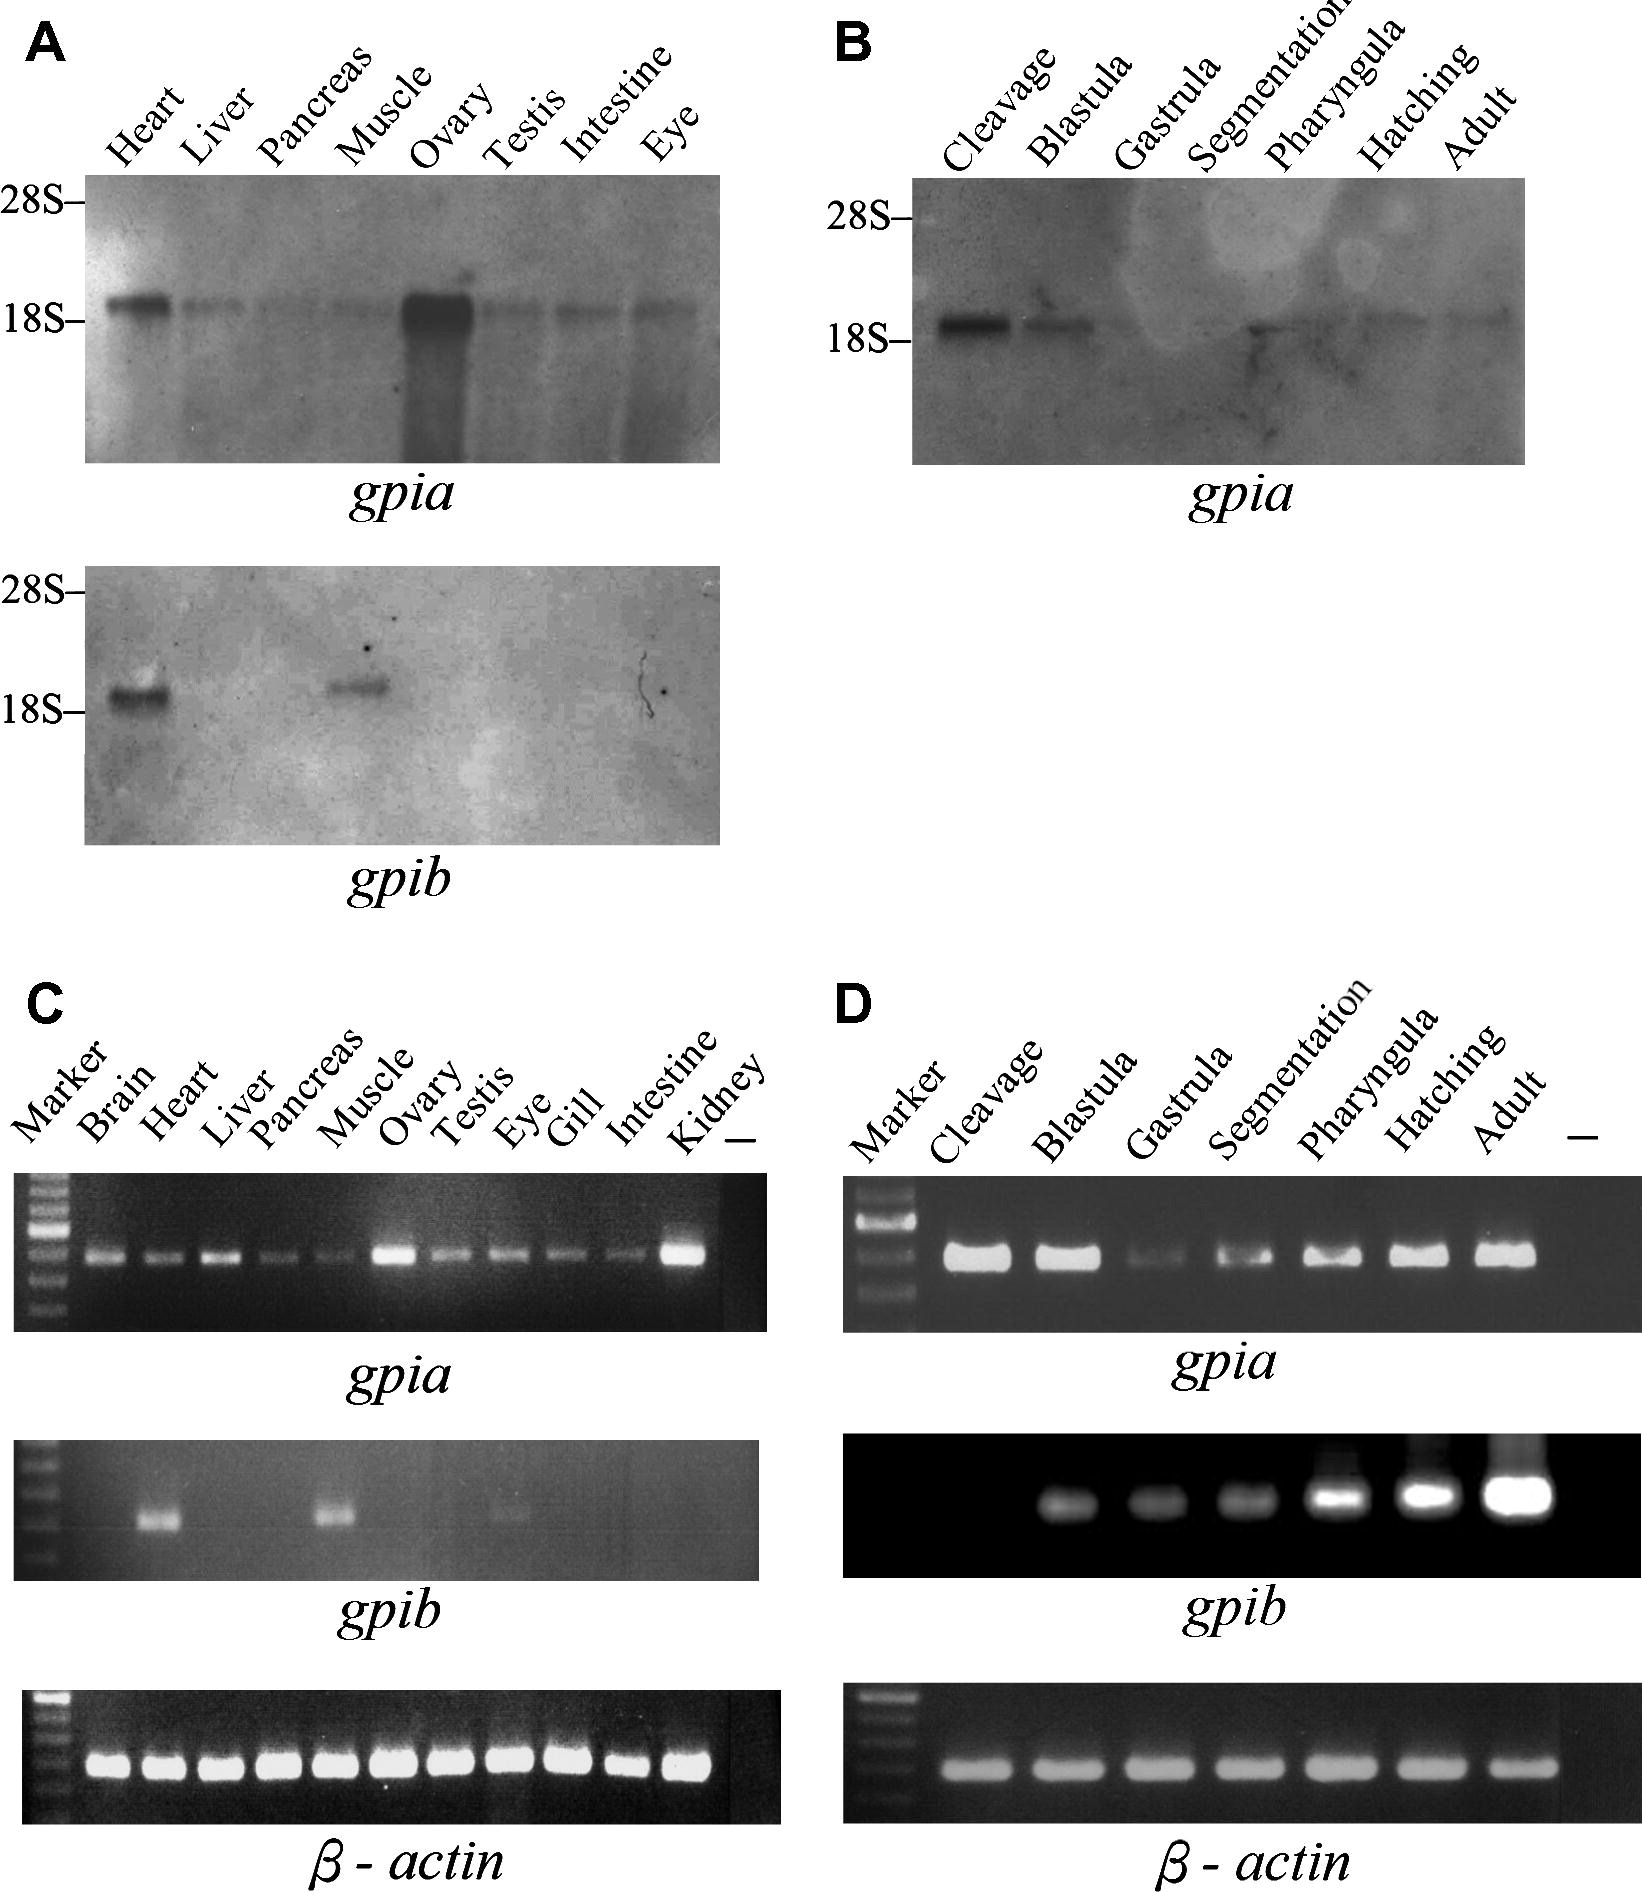
Fig. 3 Tissue and developmental expression of zebrafish gpia and gpib. (A) Northern analysis of gpia and gpib mRNA in adult tissues. The positions of 28S and 18S rRNA are indicated. (B) Northern analysis of gpia mRNA at various stages of zebrafish development. (C, D) RT-PCR analysis showing the expression of gpia and gpib in adult tissues (C) and at various developmental stages (D). Marker, 100 bp marker with the brightest band at 800 bp; -, negative control using water as template. PCR amplified 683 bp, 402 bp, and 492 bp fragments from gpia, gpib and β-actin cDNA, respectively. β-Actin was used as a reference gene for control of the amount of RNA input and sensitivity of RT-PCR analysis.
Reprinted from Gene expression patterns : GEP, 9(4), Lin, W.W., Chen, L.H., Chen, M.C., and Kao, H.W., Differential expression of zebrafish gpia and gpib during development, 238-245, Copyright (2009) with permission from Elsevier. Full text @ Gene Expr. Patterns