
|
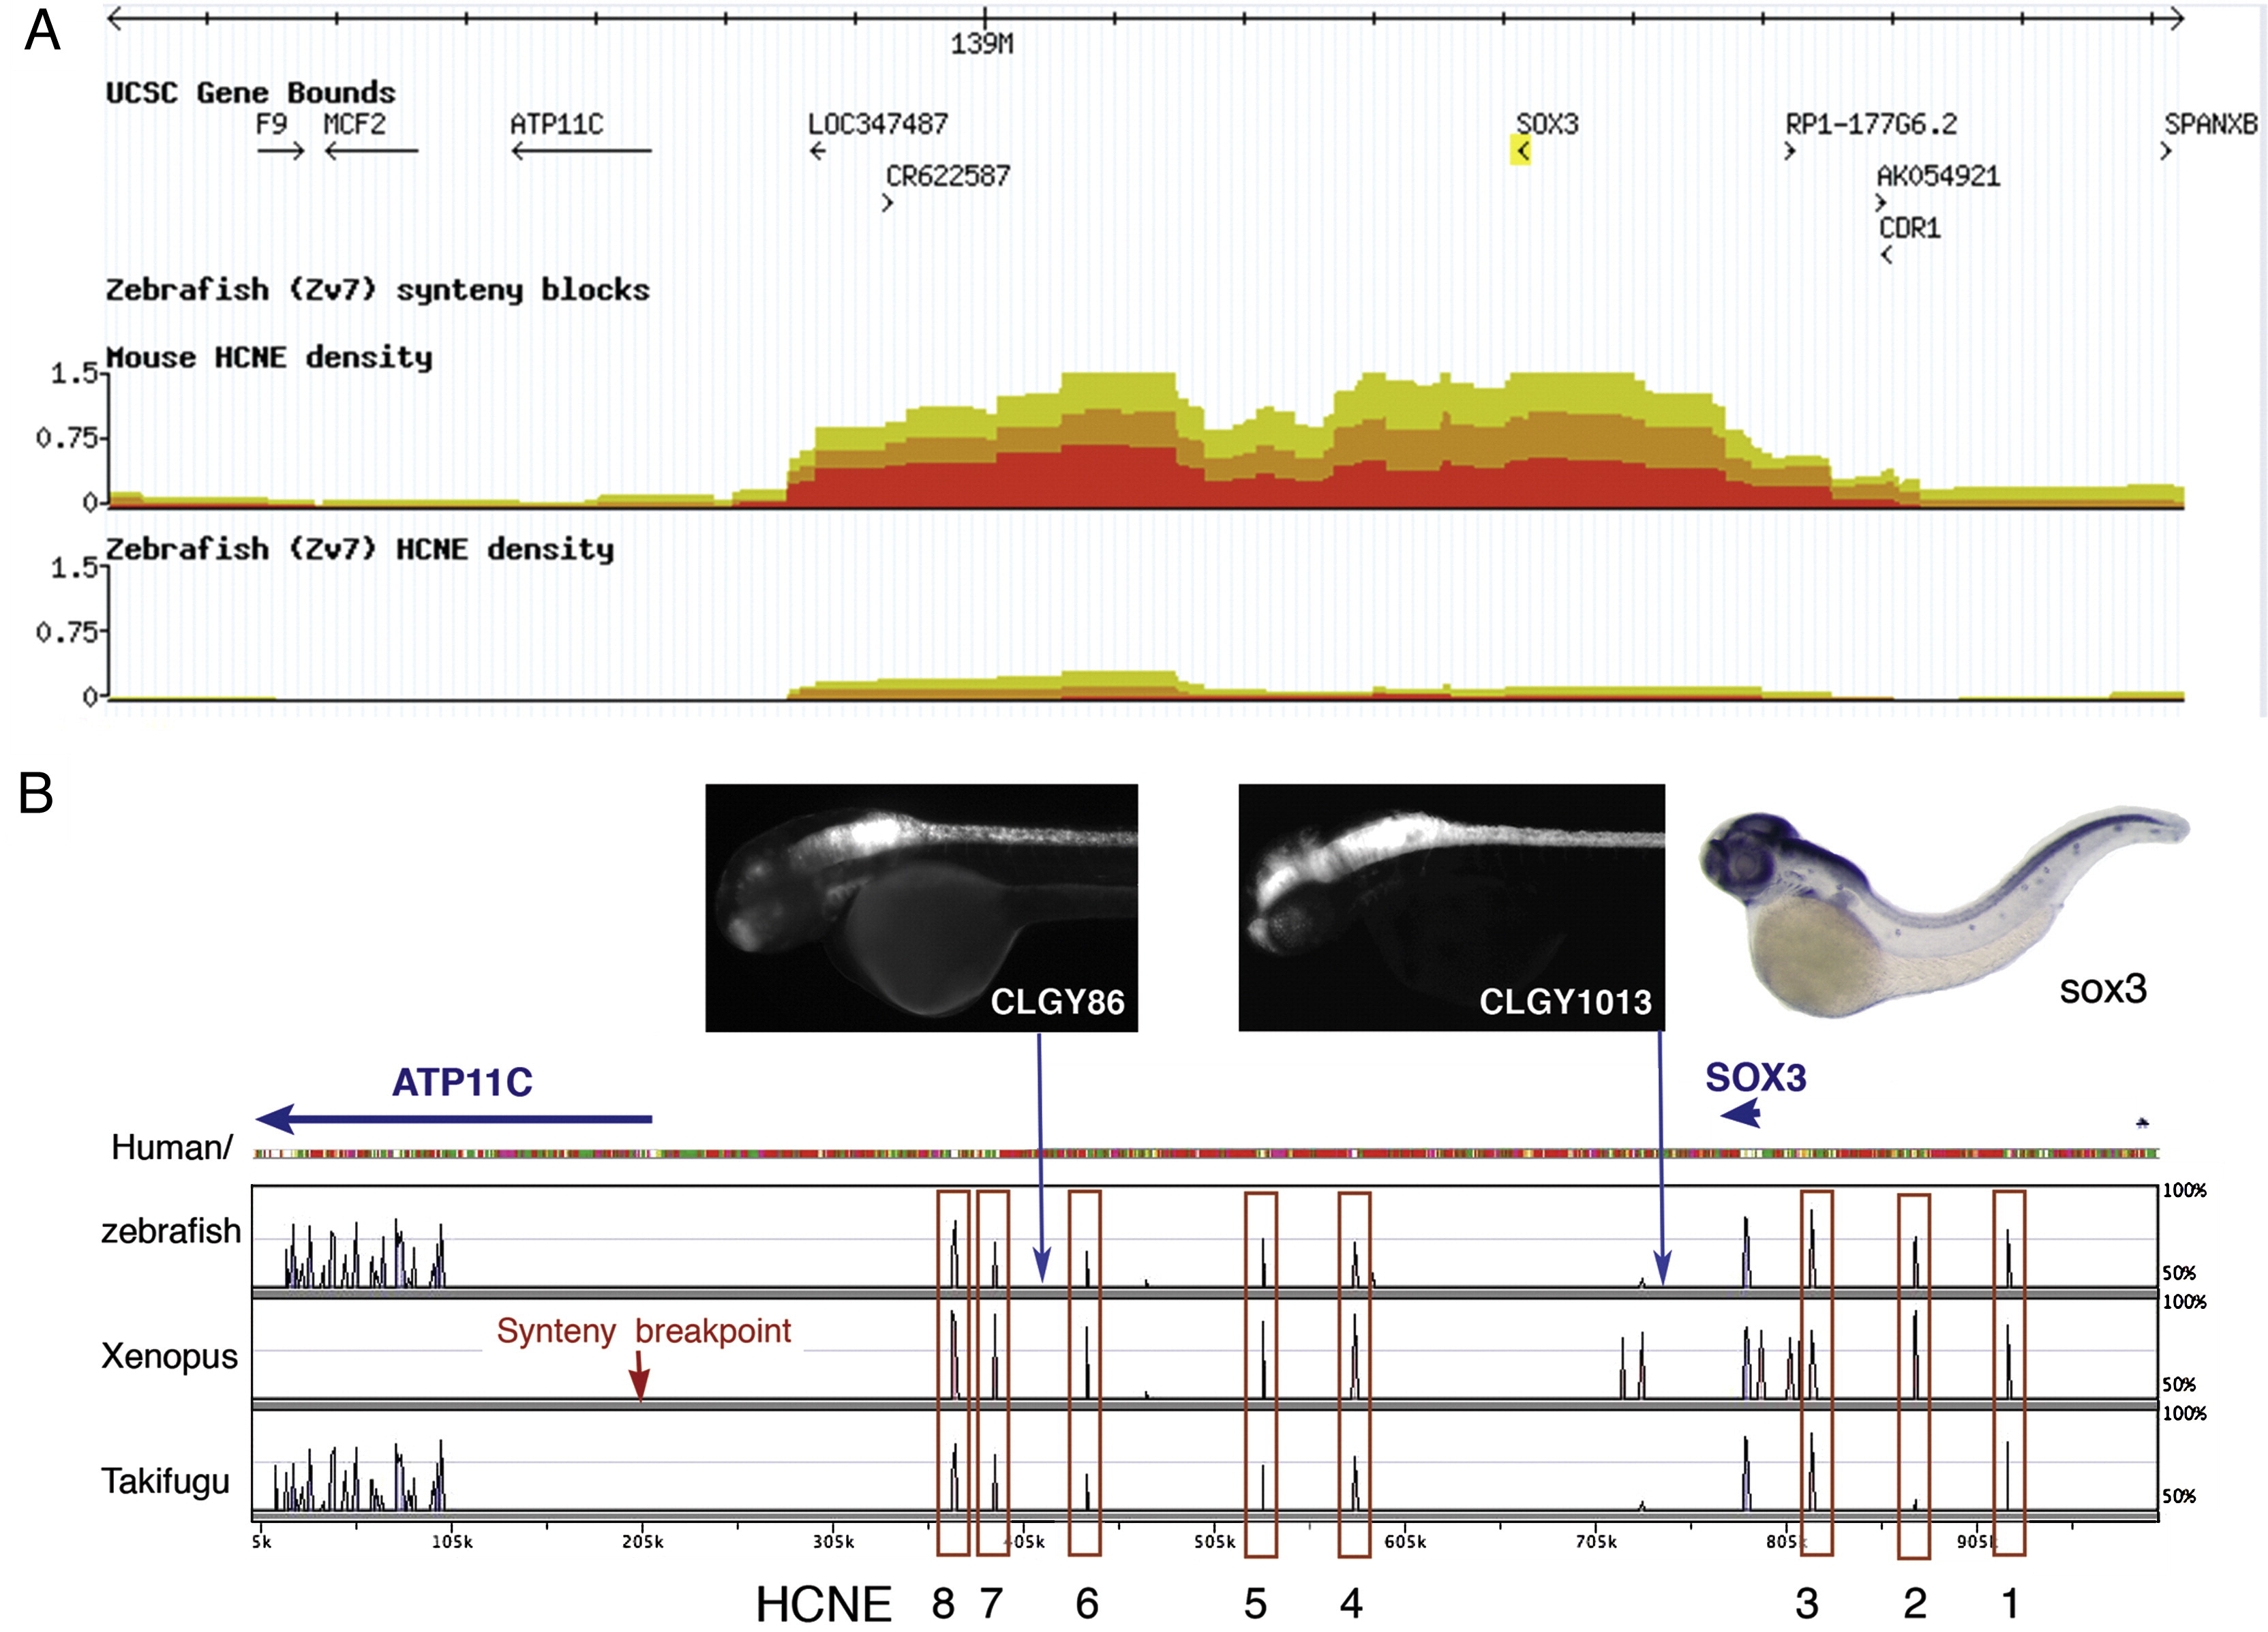
Fig. 1 The overview of genomic locus of SOX3. (A) Ancora view of a 2 Mb window across the human locus (upper track), density of HCNEs compared with the mouse genome (lower track) and conserved synteny in the zebrafish genome. (B) 1 Mb window mVISTA plot of human SOX3 compared with zebrafish (dr, upper track), Xenopus tropicalis, (xt, middle track) and Fugu rubripes (fr, lower track). HCNEs conserved in all four species were tested in zebrafish and are boxed in red. The insets above tracks show two enhancer detection insertions in the sox3 gene desert in zebrafish and the RNA in situ hybridization pattern of sox3 in a 2-day zebrafish embryo. Expression is mainly confined to the nervous system (for detailed expression domains see also Supplementary online database).
Reprinted from Developmental Biology, 327(2), Navratilova, P., Fredman, D., Hawkins, T.A., Turner, K., Lenhard, B., and Becker, T.S., Systematic human/zebrafish comparative identification of cis-regulatory activity around vertebrate developmental transcription factor genes, 526-540, Copyright (2009) with permission from Elsevier. Full text @ Dev. Biol.