
|
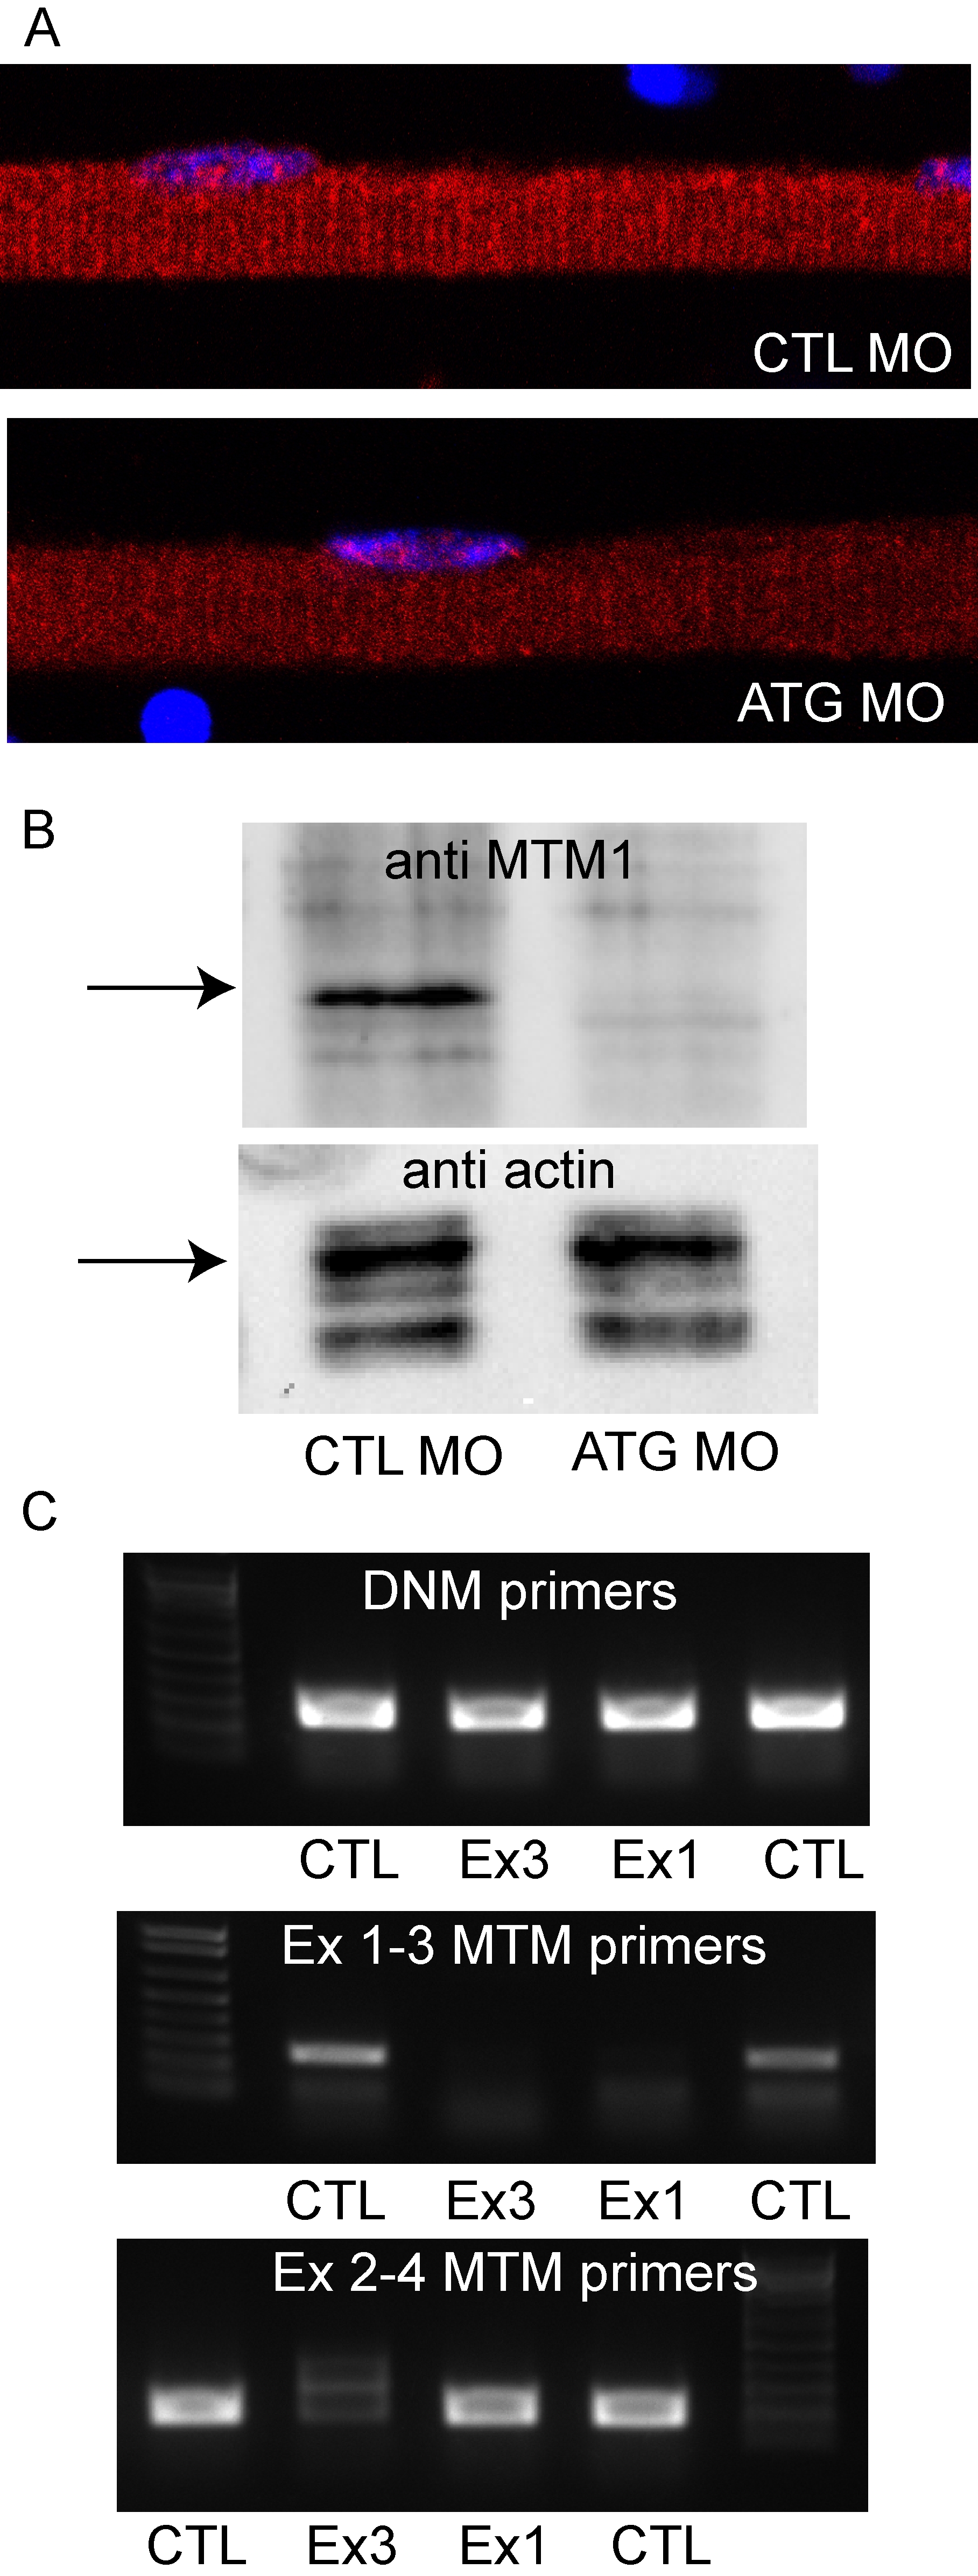
Fig. S2 Morpholino knockdown of zebrafish myotubularin. (A) Immunohistochemistry using a myotubularin antibody on isolated myofibers from embryos injected with control (CTL MO) or myotubularin ATG (ATG MO) morpholinos. The linear staining pattern observed in control myofibers (see Figure 8) was barely detectable in MTM1 morphant fibers. (B) Western blot analysis from protein isolated from 72 hpf embryos injected with control (CTL MO) or myotubularin ATG (ATG MO) morpholinos. A band corresponding to myotubularin was detected in CTLs but not in MTM morphants. Blots were re-probed with actin to assure equal loading. (C) RT-PCR analysis from RNA extracted from 48 hpf control (CTL), exon 3 specific (Ex3), and exon 1 specific (Ex1) myotubularin morphants. Top panel: dynamin-2 (DNM) specific primers reveal intact RNA and equal starting cDNA from all samples. Middle panel: primers spanning exons 1–3 reveal reduced products for both the exon 1 and exon 3 splice blocking morphants. Bottom panel: primers spanning exons 2–4 reveal substantially reduced product in the exon 3 splice blocking morphants but a normal product in the exon 1 morphants. Taken together, the RT-PCR data reveals that the Ex1 morpholino successfully results in exclusion of exon 1 from the final RNA. The Ex3 morpholino causes exclusion of exon 3 as well as overall reduction in MTM1 RNA, likely due to nonsense mediated decay mechanisms.