
Image
|
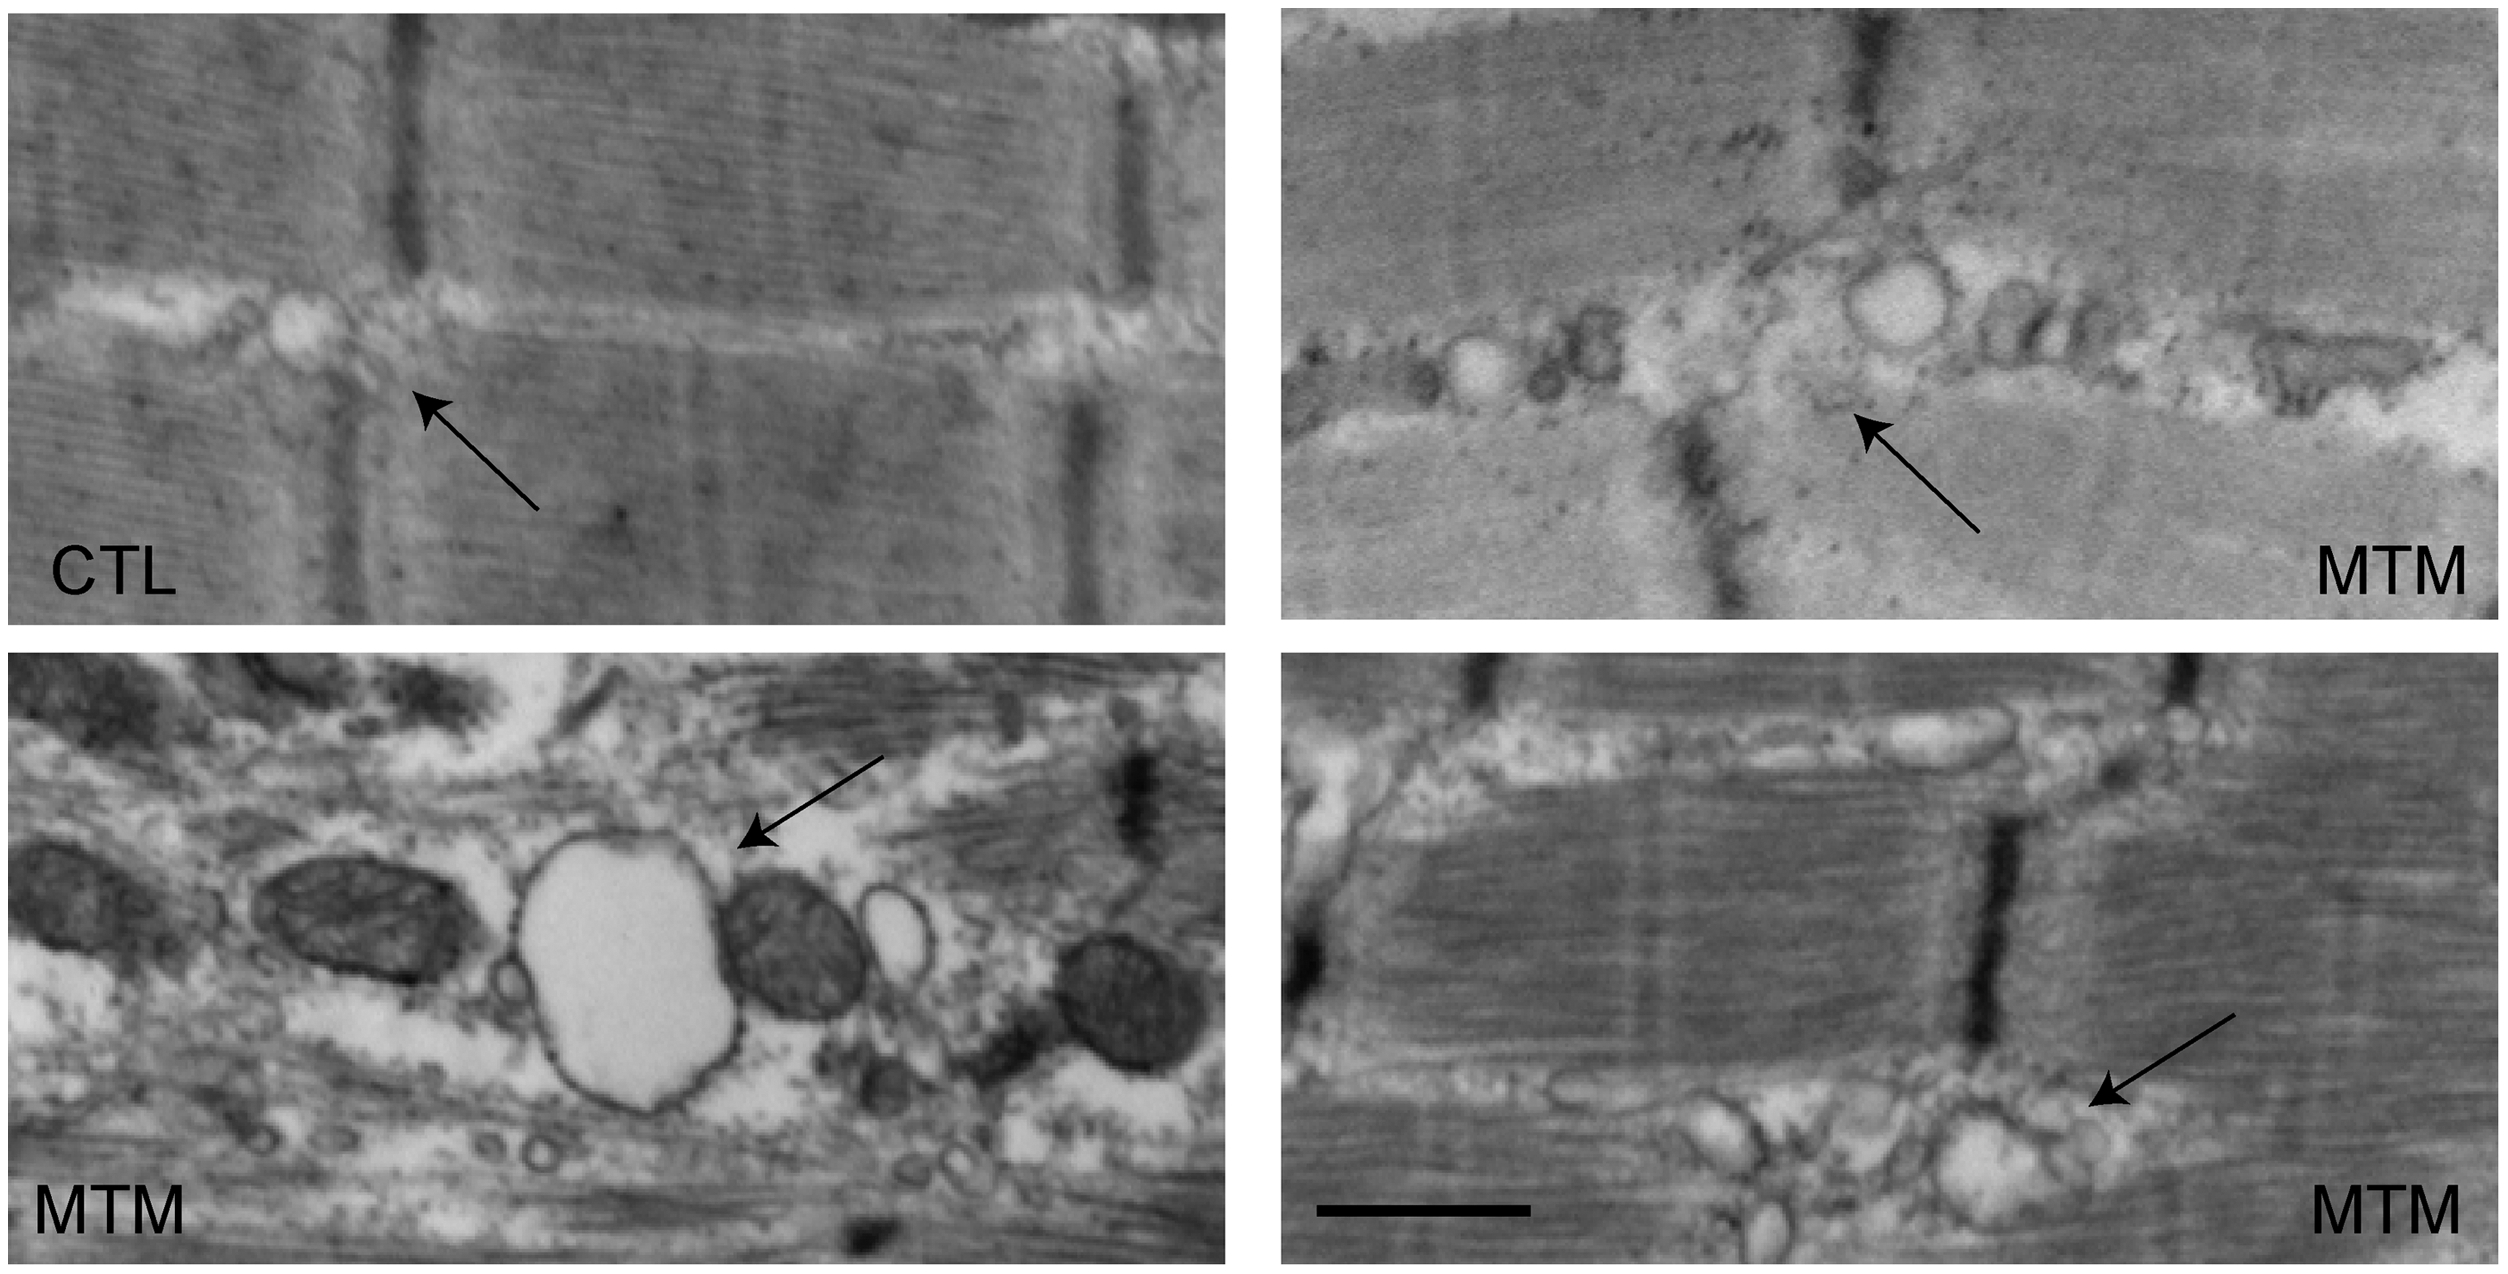
Figure Caption
Fig. 12 Ultrastructural changes in T-tubules in myotubular myopathy.
Electron microscopic analysis of muscle from 3 myotubular myopathy patients (MTM) and one age-matched control (CTL). Control T-tubule triads are discretely formed (arrow), and the adjacent SR network is thin and well organized. Triads and adjacent SR from patient biopsies are dilated and disorganized. Scale bar = 500 nm.
Acknowledgments
This image is the copyrighted work of the attributed author or publisher, and
ZFIN has permission only to display this image to its users.
Additional permissions should be obtained from the applicable author or publisher of the image.
Full text @ PLoS Genet.