
|
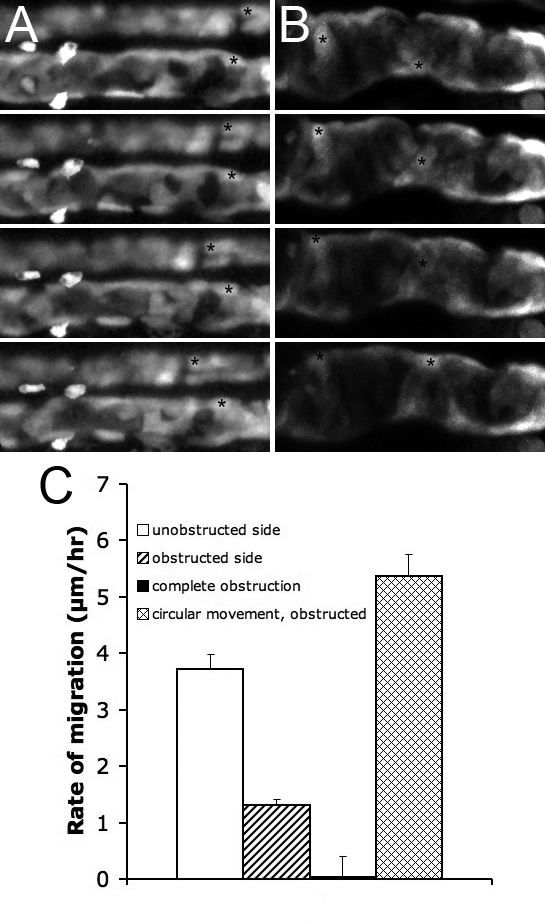
Fig. 6 Pronephric Obstruction Blocks Proximal Cell Migration
(A) Unilateral obstruction, NaK ATPase:GFP, the obstructed side is shown below the control side.
(B) Complete obstruction, ET11–9 GFP transgenic. The epithelial cells move circumferentially. Frame intervals in (A, B) are 2.5 h, scale bar: 70 μm.
(C) Rates of migration in various conditions, from left to right: unilateral obstruction, unobstructed side (white bar); unilateral obstruction, obstructed side (striped bar); complete obstruction, rate of anterior migration (black bar); complete obstruction, rate of circumferential movement (mesh bar). Each bar represents average over a number of cells within a single experiment.