
|
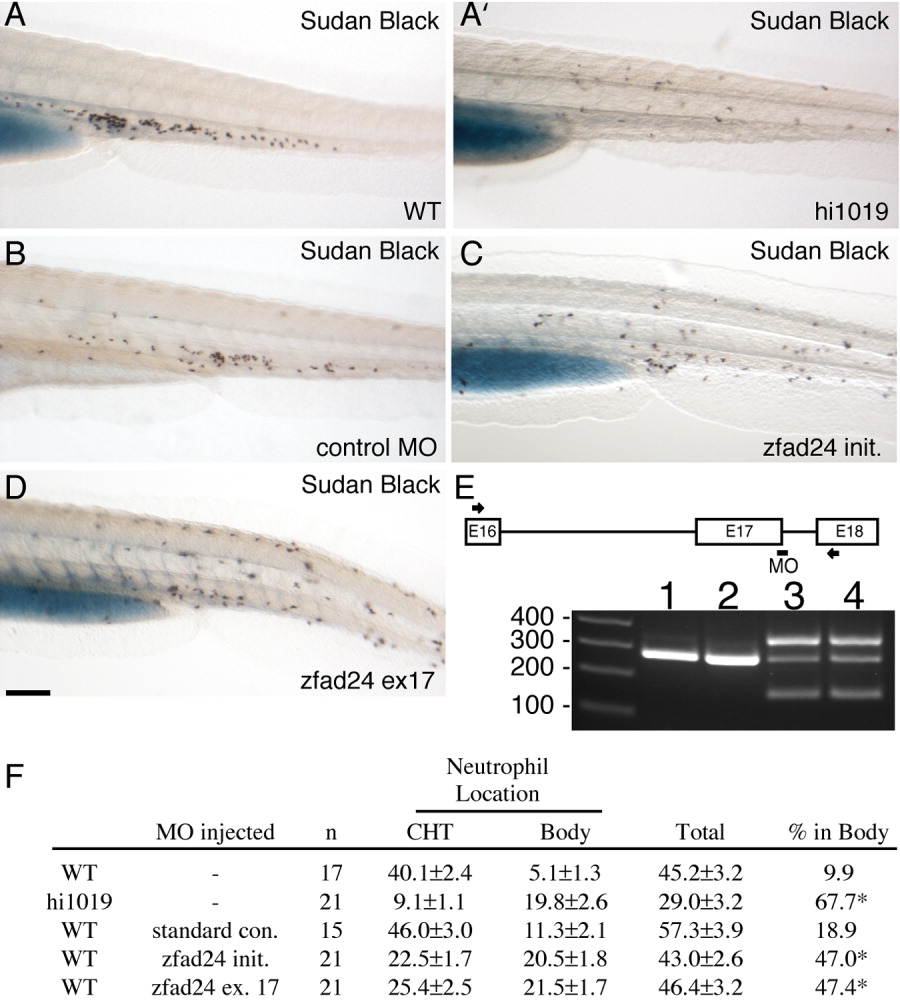
Fig. 2 Injection of fad24 MO into WT embryos phenocopies the fad24hi1019 leukocyte infiltration phenotype. Shown is the CHT and surrounding tissues of sudan black stained WT (A) and fad24hi1019 (A′) larvae or control MO- (B), zfad24 init. MO- (C), or zfad24 ex17 MO- (D) injected larvae. Lateral view, anterior to the left at 3 dpf. Scale bar = 200 μm. E: Schematic of fad24 exon 16, 17, and 18 with the target site of the zfad24 ex17 MO labeled. Arrows, locations of primers used for RT-PCR of total RNA isolated from single embryos at 24 hr post-injection of either uninjected (lane 1), standard control (lane 2), or zfad24 ex17 (lanes 3 and 4) MO. F: Quantification of neutrophil location (either in the CHT or in the body) seen in WT and fad24hi1019 larvae or control MO-, zfad24 init. MO-, or ex17 MO-injected larvae analyzed by one-way ANOVA at a 95% confidence level using Dunnett's multiple comparison post-test. *P < 0.05. Results reported as average ± SEM.