
|
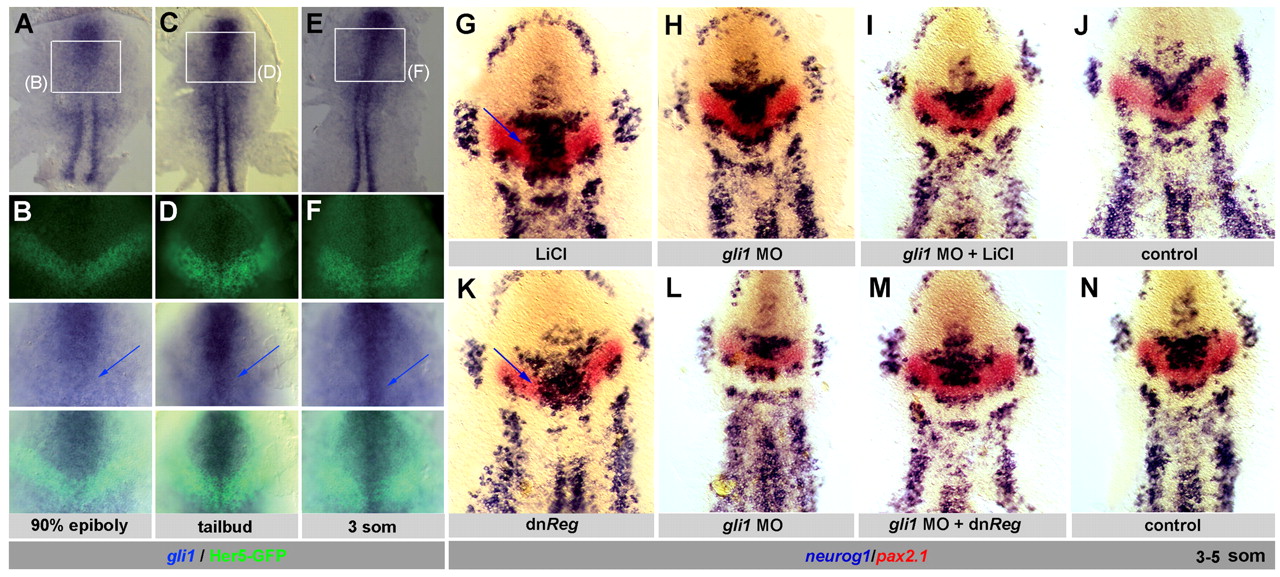
Fig. 6 MIZ and LIZ cells differ in their expression of Gli1, which promotes neurogenesis and antagonizes PKA during IZ formation. (A-F) Expression of gli1 (blue) and Her5-GFP (green) in Tg(her5PAC:EGFP)ne1939 transgenic zebrafish embryos (flat-mounted, anterior up) shows that gli1 is transcribed at higher levels in the MIZ (arrows) than in the LIZ. B,D,F are high-magnification views of the boxed areas in A,C,E respectively, viewed sequentially (from top to bottom) under bright field, fluorescence and simultaneous bright field and fluorescence illumination. (G-N) Embryos analyzed at the 3- to 5-somite stage for neurog1 and pax2.1 (color-coded) and flat-mounted, anterior up. Blue arrows indicate ectopic neurog1 expression. (G-J) Blocking Gli1 activity does not affect IZ formation (H, compare with control J), but prevents the induction of neurog1 expression across the MIZ that is normally triggered by LiCl (I, compare with G). (K-N) Blocking Gli1 activity is sufficient to rescue the MIZ normally lost upon PKA downregulation (M, compare with K). (N) Control.