
Fig. 5
- ID
- ZDB-IMAGE-090106-5
- Genes
- Publication
- Ninkovic et al., 2008 - Gsk3{beta}/PKA and Gli1 regulate the maintenance of neural progenitors at the midbrain-hindbrain boundary in concert with E(Spl) factor activity
- All Figures
- Figures for Ninkovic et al., 2008
|
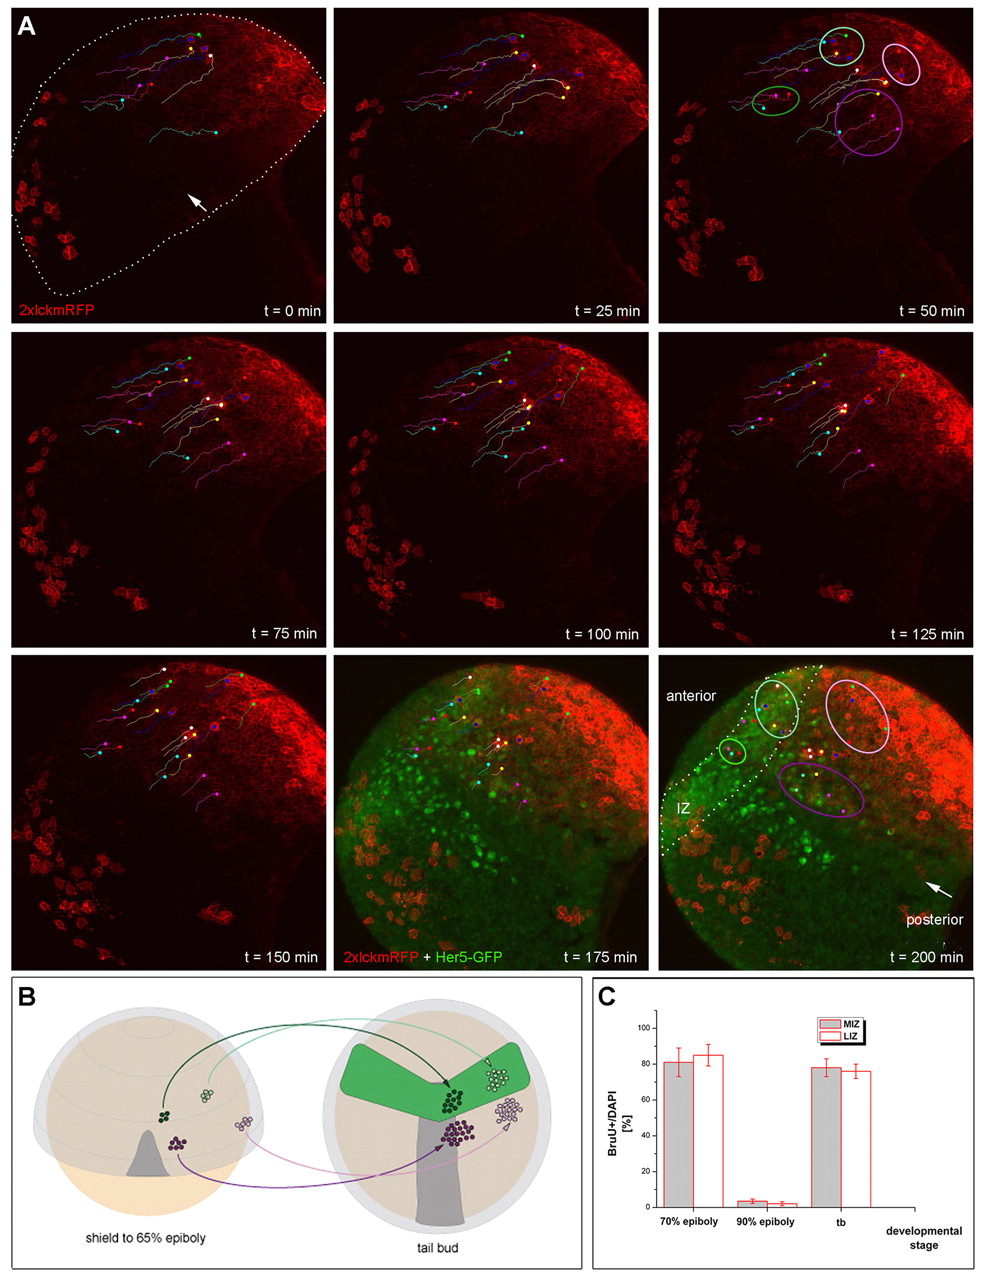
Fig. 5 MIZ and LIZ cells differ in lineage but not in proliferation characteristics. (A) The origin of cells located within the MIZ (outlined in dark green), LIZ (outlined in pale green), r2M (outlined in purple) and r2L (outlined in pink) was tracked in live confocal movies. The cells were followed from shield (top left) to tailbud stage (bottom right) with membrane-localized 2xlckmRFP (red) in Tg(her5PAC:EGFP)ne1939 transgenic embryos. GFP (green) reveals the location of the IZ at tailbud stage (see t=175 and t=200 minutes). Confocal optical projections at 25-minute intervals, in which some tracked cells are identified with colored dots and lines. The same color is used for the same cell on each panel, and indicates the location of the cell at each time. The line indicates the path that will be followed by this cell to reach its final position at t=200 minutes. The tracking of individual cells shows that the four populations (MIZ, LIZ, r2M and r2L) maintain their relative positions throughout the movie. Landmarks: location of the notochord, white arrow; IZ, dots. Number of embryos analyzed is 4. The total number of cells tracked in the movie illustrated is 26. (B) Schematics illustrating the relative positions of the four cell populations (color-coded as above) at shield and tailbud stages. Dark gray, notochord; light gray, neuroectoderm; green, Tg(her5PAC:EGFP)ne1939 expression domain. (C) Comparison of cell cycle characteristics of MIZ and LIZ cells during the time of IZ formation. The percentage of cells incorporating BrdU among all MIZ or LIZ cells (DAPI) is identical at all stages.