
|
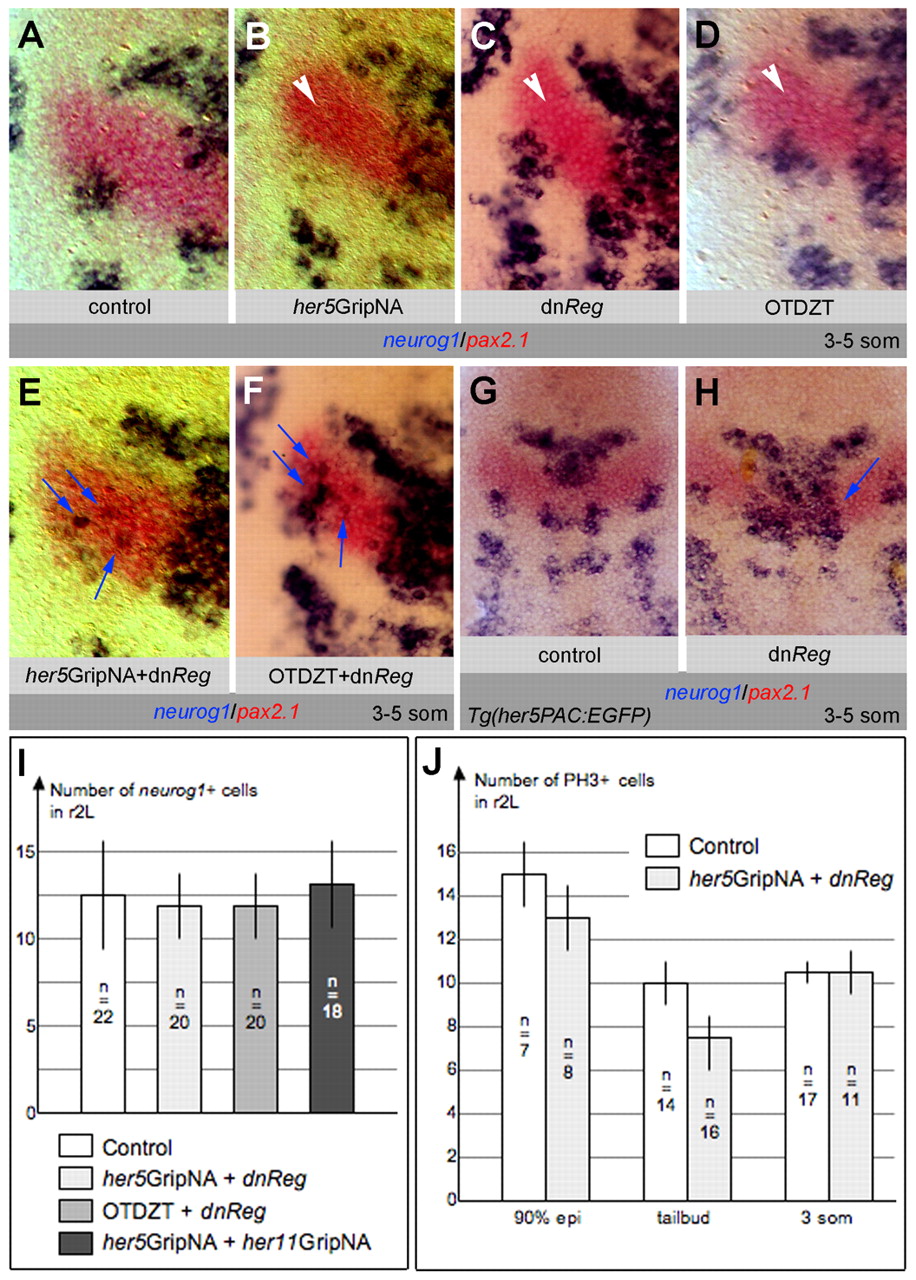
Fig. 4 Activated PKA is required for IZ formation in cooperation with Gsk3β and E(Spl) activity. (A-H) Zebrafish embryos analyzed at the 3- to 5-somite stage for neurog1 and pax2.1 and flat-mounted, anterior up. (A-F) High magnifications of one half of the neural plate; blue arrows indicate ectopic neurog1 expression, white arrowheads indicate neurog1-free LIZ. (A-C,E) Expression of a dominant-negative form of PKA (dnReg) induces neurog1 expression across the MIZ (C), as occurs upon downregulating E(Spl) (B). Concomitant blockade of both pathways leads to ectopic LIZ neurog1 expression (E, compare with B,C). (D,F) Inhibiting Gsk3β or PKA activity with OTDZT leads to loss of the MIZ (C,D, see also Fig. 2K,K′), whereas co-inhibition also induces ectopic neurog1 expression within the LIZ (F). (G,H) The effect of blocking PKA remains unchanged in the Tg(her5PAC:EGFP) background (H, compare with C), in which one additional copy of the her11 gene is expressed. (I,J) The number of neurog1-expressing cells (I) and of cells in M phase (J) in the r2L domain is unchanged in embryos in which Her5 and PKA blockade triggers ectopic LIZ neurog1 expression (lightest gray boxes). In I, several other conditions triggering ectopic LIZ neurog1 expression are further compared (blockade of Gsk3β and PKA, medium gray box; blockade of Her5 and Him, dark gray box) with the same result. Bars indicate standard errors; n, the number of embryos analyzed.