
|
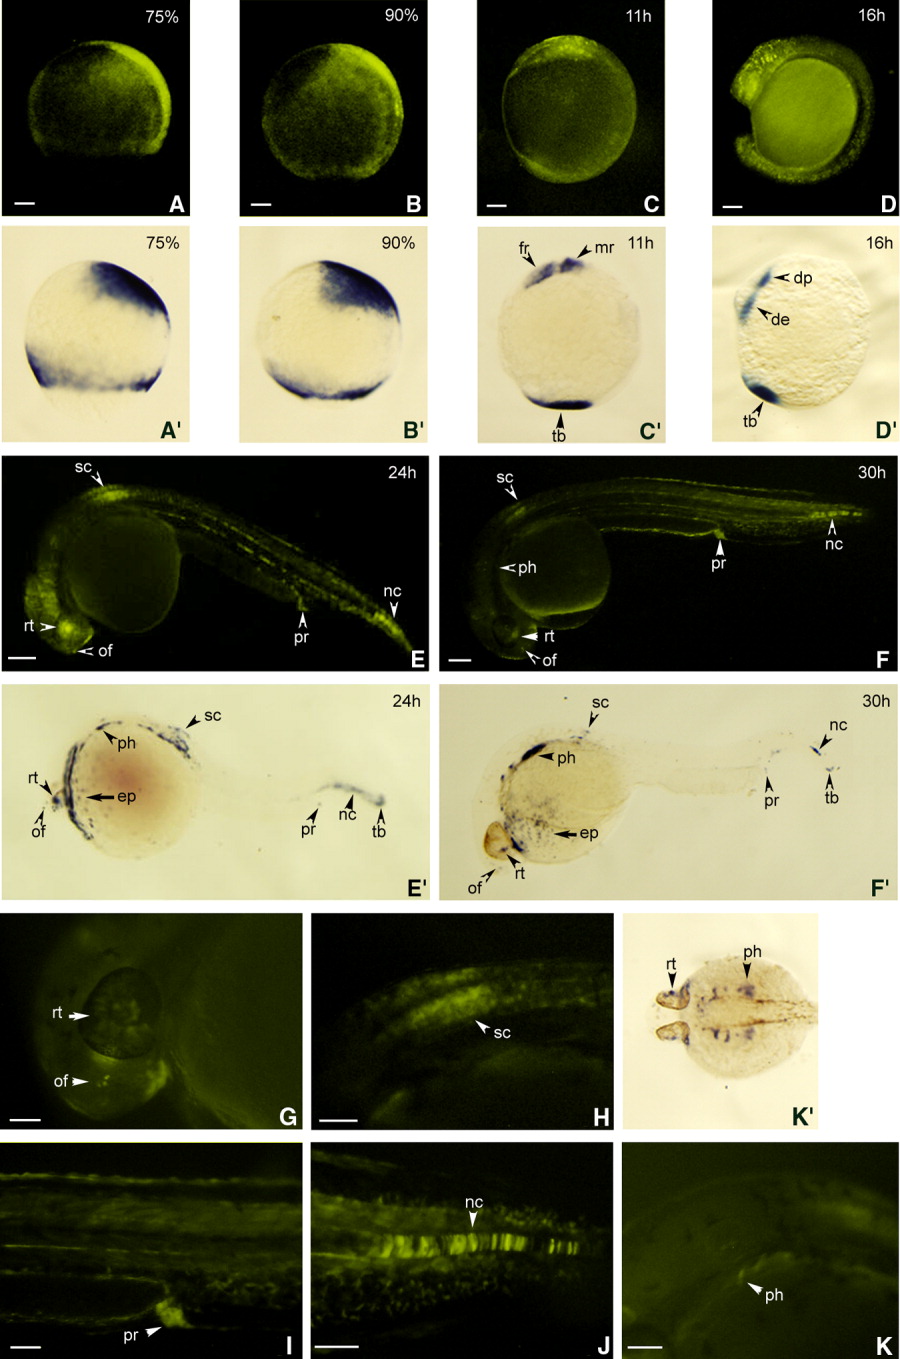
Fig. 5 Expression pattern of transgenic reporter in zebrafish early development. Transgenic embryos are produced by a female wild-type zebrafish mated with a male transgenic zebrafish. A-K: Fluorescent images are photographed by the DP70 digital camera with 10-sec exposure time. A′-F′,K′: Whole-mount in situ hybridization is performed to reveal the expression pattern of cyp26a1. Embryos are laterally viewed (except that K′ is dorsal viewed) and positioned animal pole top (A,B; A′,B′), anterior top (C,D; C′,D′), or anterior left (E-K; E′-K′). A,B: Enhanced yellow fluorescent protein (eYFP) is initially detected at presumptive neural plate and around the blastoderm margin of the embryo at 75% epiboly (A) and then 95% epiboly (B). The fluorescent expression patterns mimic the expression of cyp26a1 at 75% epiboly (A′) and 95% epiboly (B′), respectively. C,C′: At 11 hours postfertilization (hpf), eYFP is strong at the presumptive brain region and the tail bud (C), corresponding to the cyp26a1 expression at presumptive forebrain, midbrain and the tail bud (C′). D,D′: At 16 hpf, the transgene signals are present in developing eyes, pharyngeal arches and tail bud (D) where the cyp26a1 is also expressed (D′). E,E′: At 24 hpf, the fluorescent signals are mainly present in retina, cells in olfactory vesicle, anterior dorsal spinal cord, proctodeum, and caudal notochord (E) where the cyp26a1 is also expressed (E′). F,F′,K′: At 30 hpf, the expression pattern of the transgene (F) is similar to that of cyp26a1 (F′, K′). G-K: High magnification reveals that the fluorescent signals are mainly present in retina (G), cells in olfactory vesicle (G), anterior dorsal spinal cord (H), proctodeum (I), caudal notochord (J), and pharyngeal arches (K). de, developing eye; dp, developing pharyngeal arch; ep, epidermis; fr, presumptive forebrain; mr, presumptive midbrain; nc, caudal notochord; of, cells in olfactory vesicle; ph, pharyngeal arch; pr, proctodeum; rt, retina; sc, anterior dorsal spinal cord; tb, tail bud. Scale bar = 100 μm.