
Fig. 3
|
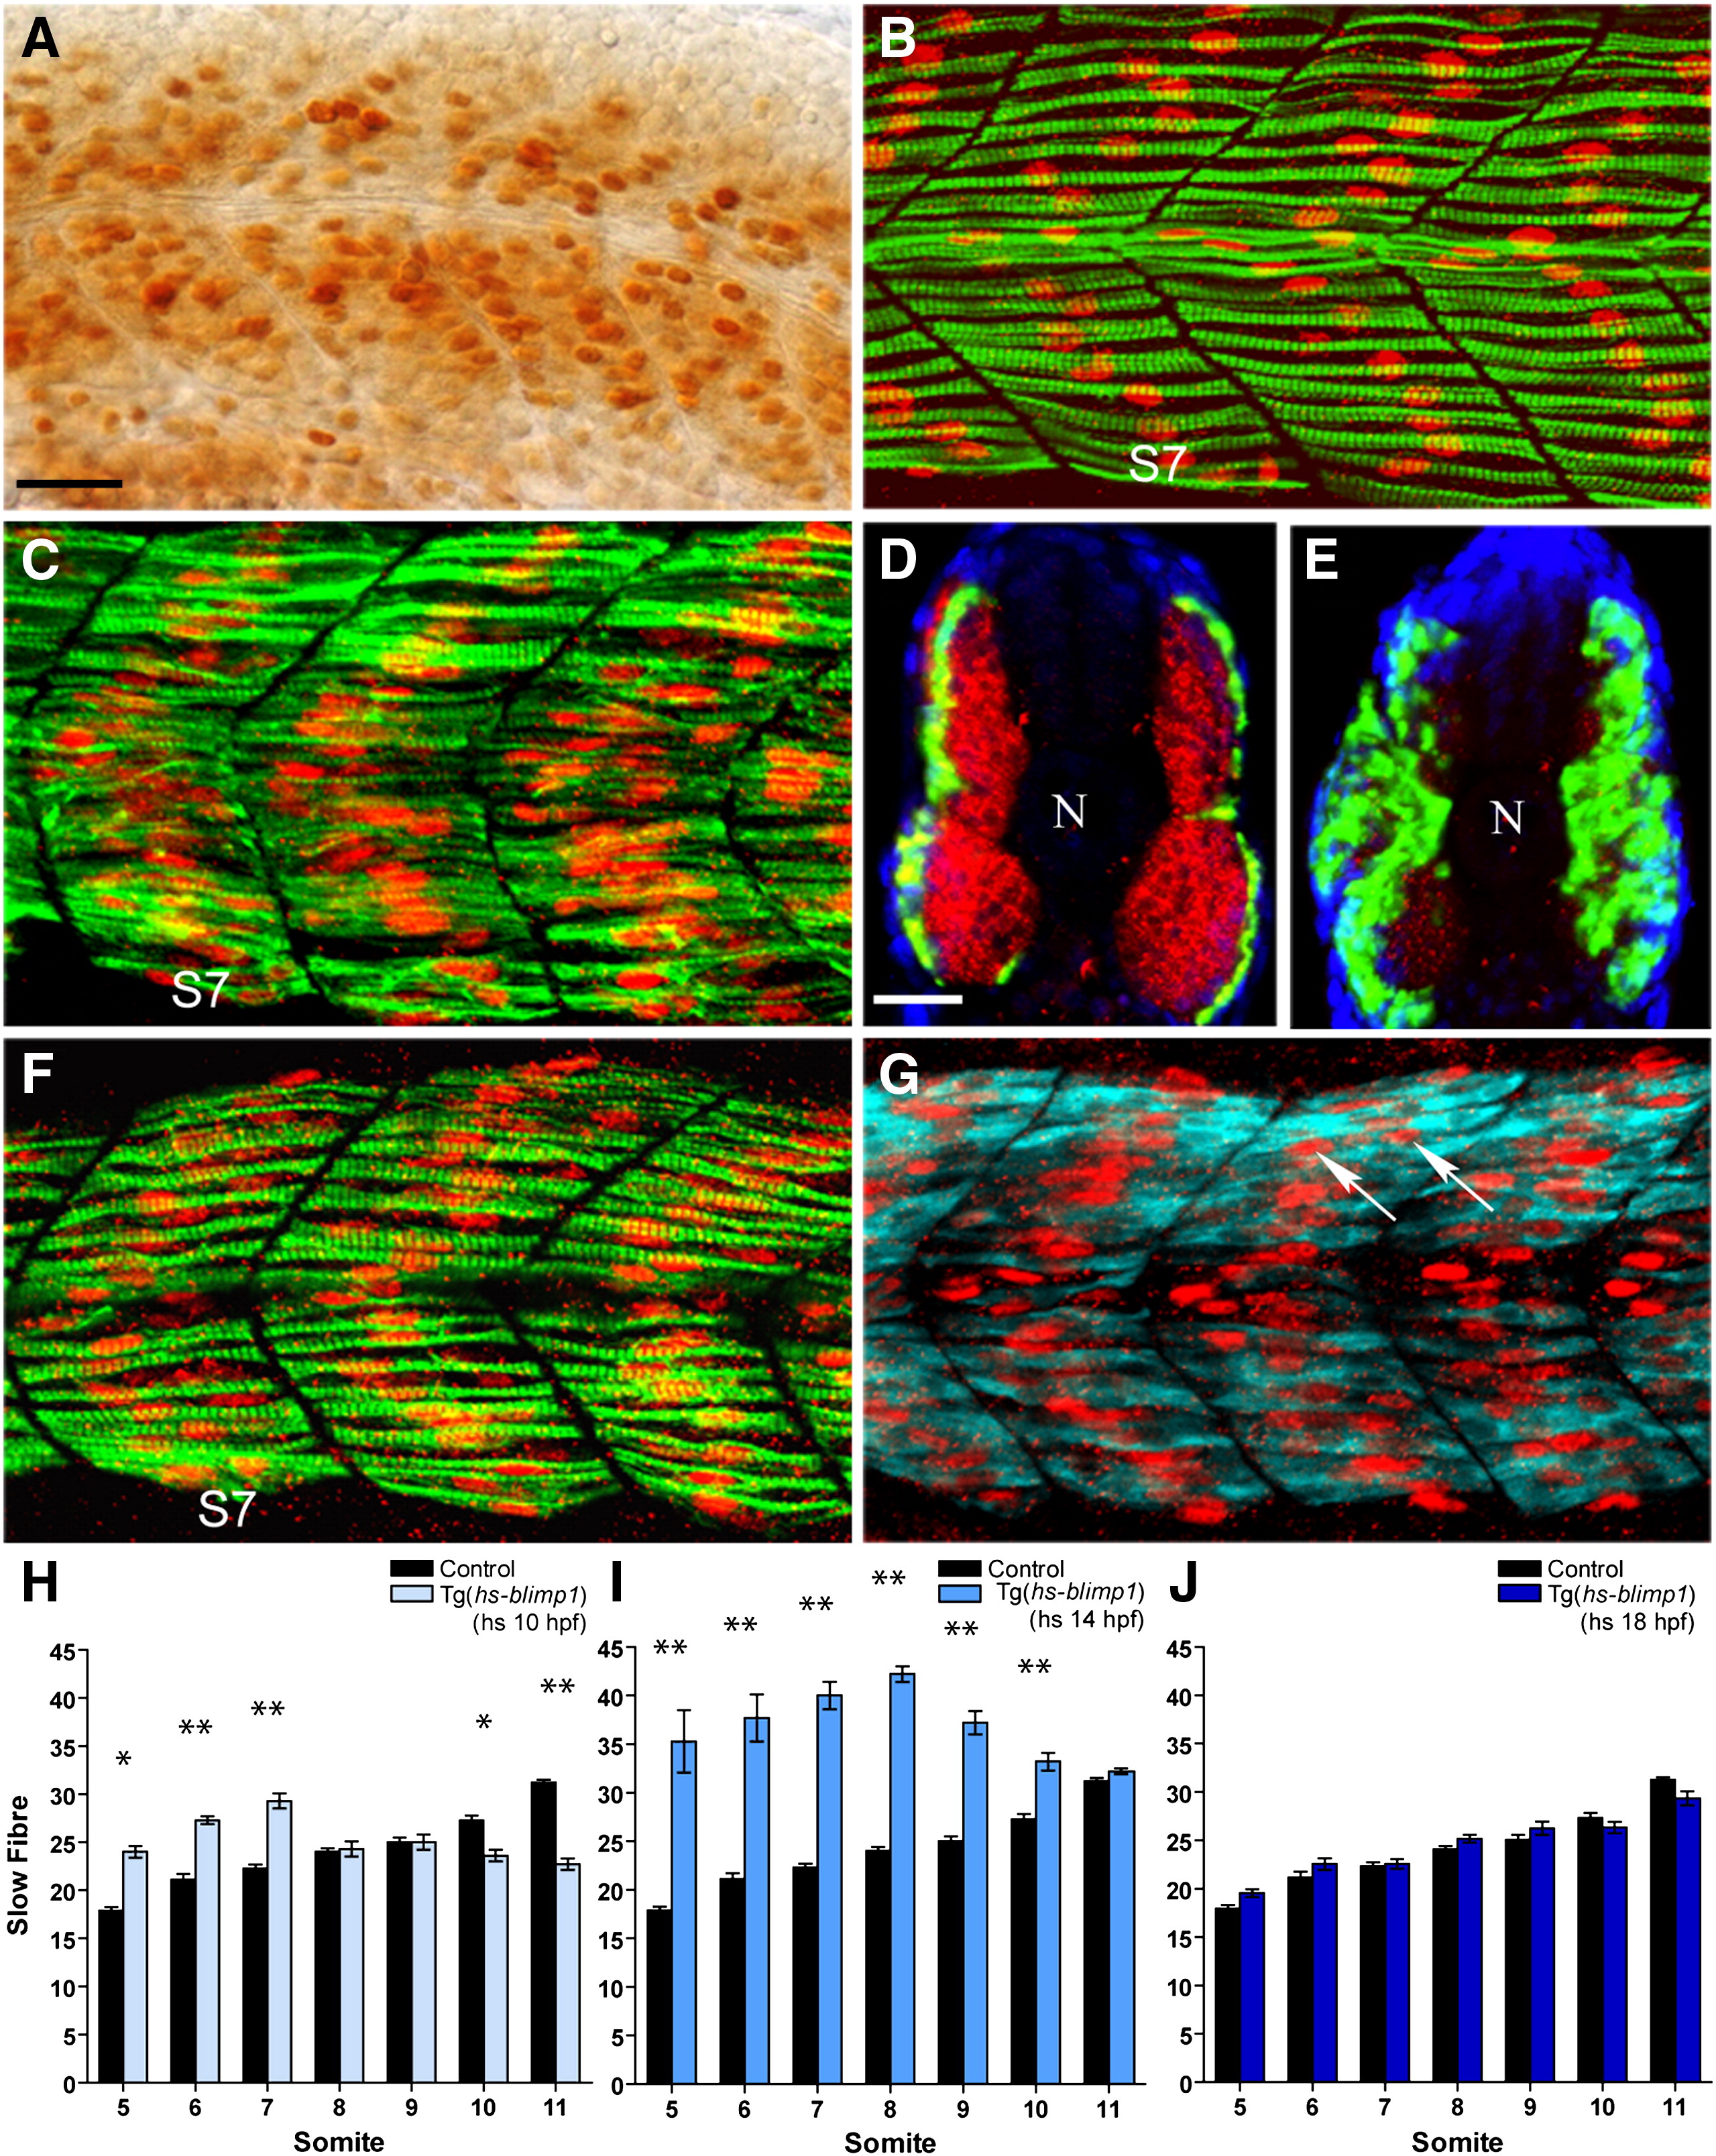
Fig. 3 Competence of somitic myoblasts to respond to Blimp1 and adopt the slow fate changes as a function of time. (A) High level of Blimp1 protein expression (arrows) throughout the myotome in a heat induced Tg(hs::blimp1) transgenic embryo. (B) Slow muscle fibers in an uninduced 24 hpf Tg(hs::blimp1) embryo is indistinguishable from wild-type. S7 denotes somite 7. (C) 24 hpf Tg(hs::blimp1) embryo that received a heat pulse at 14 hpf showing supernumerary slow muscle fibers (cf. panel B). In panels B and C, Slow MyHC is shown in green and Prox1 in red. (D) Expression of smyhc1 mRNA (green) and fast myosin light chain protein (red) in an uninduced Tg(hs::blimp1) embryo. (E) Induction of ectopic Blimp1 expression in Tg(hs::blimp1) embryos at 14 hpf results in an increase in the number of slow muscle fibers (smyhc1 expression, green) at the expense of fast muscle fibers (red). In panels D and E, nuclear staining with DAPI is shown in blue and position of the notochord marked with “N”. (F) Late induction of the blimp1 transgene (at 18 hpf) did not result in significant differences in the number of slow fibers (slow MyHC, green; Prox1, red) compared to an untreated embryo (cf. panel B). (G) The slow muscle marker Prox1 (red, arrows) is ectopically induced in multi-nucleated fast fibers (expressing fast myosin light chain, cyan) by induction of the blimp1 transgene at 18 hpf. (H–J) Numbers of slow muscle fibers in somites 5–11 of Tg(hs::blimp1) embryos were scored and presented as bar charts for blimp1 induction at 10 hpf (H), 14 hpf (I) and 18 hpf (J). There are significant differences in the number of slow fibers in somites 5–7 with induction of blimp1 at 10 hpf (p < 0.05, n = 12). More myoblasts were responsive to Blimp1 activity at 14 hpf resulting in a more significant increase in the number of slow fibers (p < 0.01, n = 12). Induction of blimp1 at 18 hpf did not result in significant changes in the number of slow fibers (n = 15). The error bars represent the standard error of mean (S.E.M), ** represents p < 0.01 and * represents p < 0.05). Panels A–C, F, and G depict lateral views; panels D and E depict transverse sections. Scale bars = 25 μm. The scale bar in A applies to B, C, F and G and the scale bar in D applies to E.
Reprinted from Developmental Biology, 324(2), Liew, H.P., Choksi, S.P., Wong, K.N., and Roy, S., Specification of vertebrate slow-twitch muscle fiber fate by the transcriptional regulator Blimp1, 226-235, Copyright (2008) with permission from Elsevier. Full text @ Dev. Biol.