
|
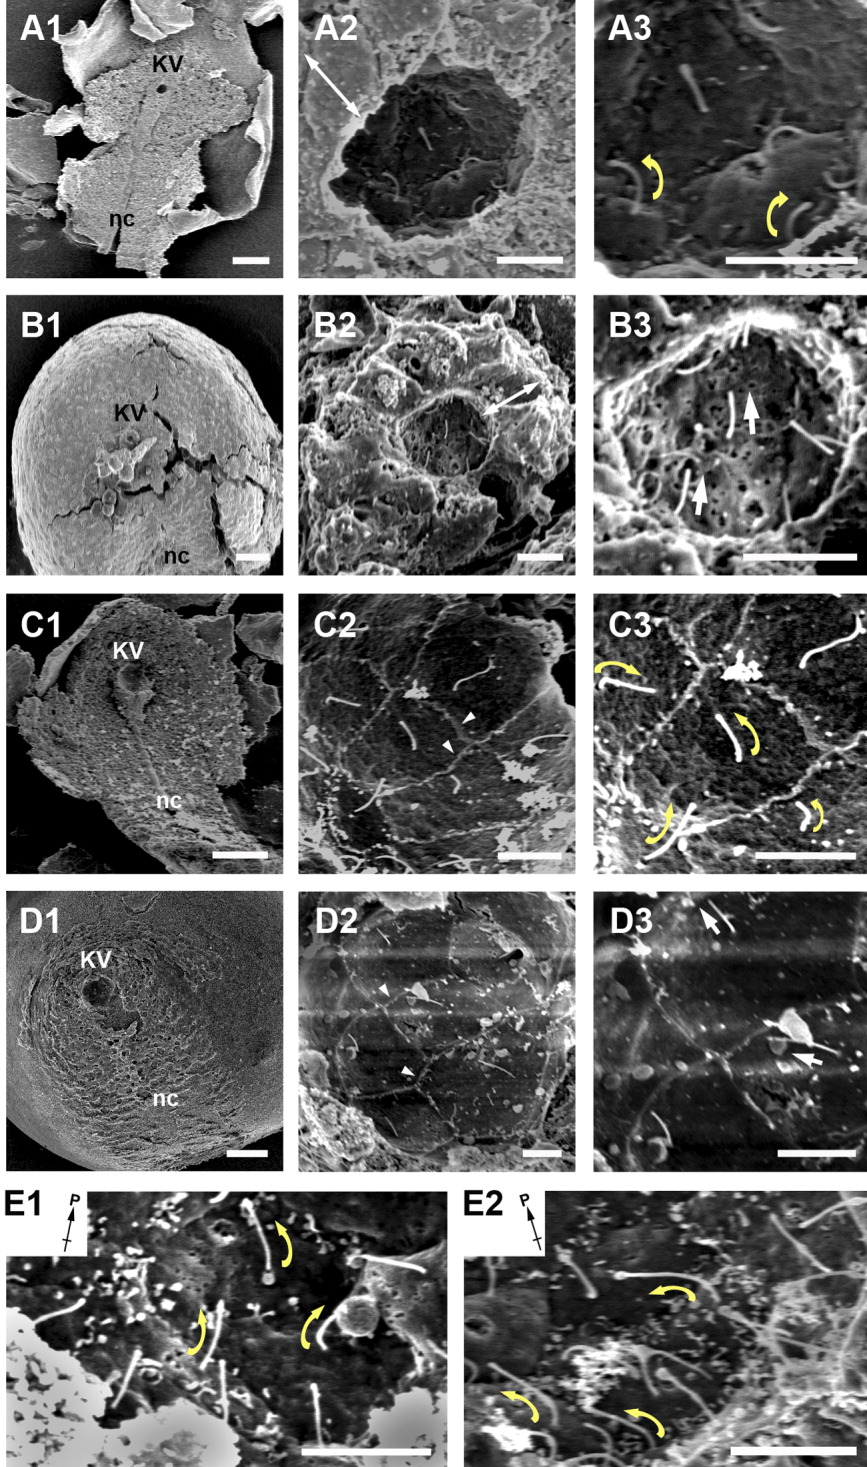
Fig. 2 Monocilia project from cells lining both the ventral floor and dorsal roof of Kupffer's vesicle in zebrafish. A-E: Scanning electron microscopy (SEM) analysis of Kupffer's vesicle at the 3-somite stage (A,B), 7-somite stage (E1), 9-somite stage (E2), and 11- to 12-somite stage (C,D). In each row of A-D, higher magnification images are presented with low magnification in the left to highest magnification at the right. Monocilia (arrows) project from individual cells. Cells are distinguishable due to their cell borders (arrowheads). Each image is representative of embryos at these stages (Nemb = 5 for 3- to 4-somite stages, Nemb = 6 for 7-somite stages, Nemb = 11 for 9-somite stages, Nemb = 11 for 11 somite stages). Double-headed arrows indicate cells viewed laterally. Cilia direct toward the posterior (B3,D3, white arrows) and the cilia at the dorsal-anterior roof (A3, C3, E1, E2) bend toward the membrane (yellow arrows). In all images, posterior is to the top. Inset in E1, E2 denotes the posterior of the embryo. The left side of the embryo is to the right side of the panels in B1-B3, D1-D3 and to the left side of the panels in A1-A3, C1-C3, E1-E2. Scale bars = 50 μm in A1,B1,C1,D1, 5 μm in A2-A3,B2-B3,C2-C3,D2-D3,E1-E2.