
|
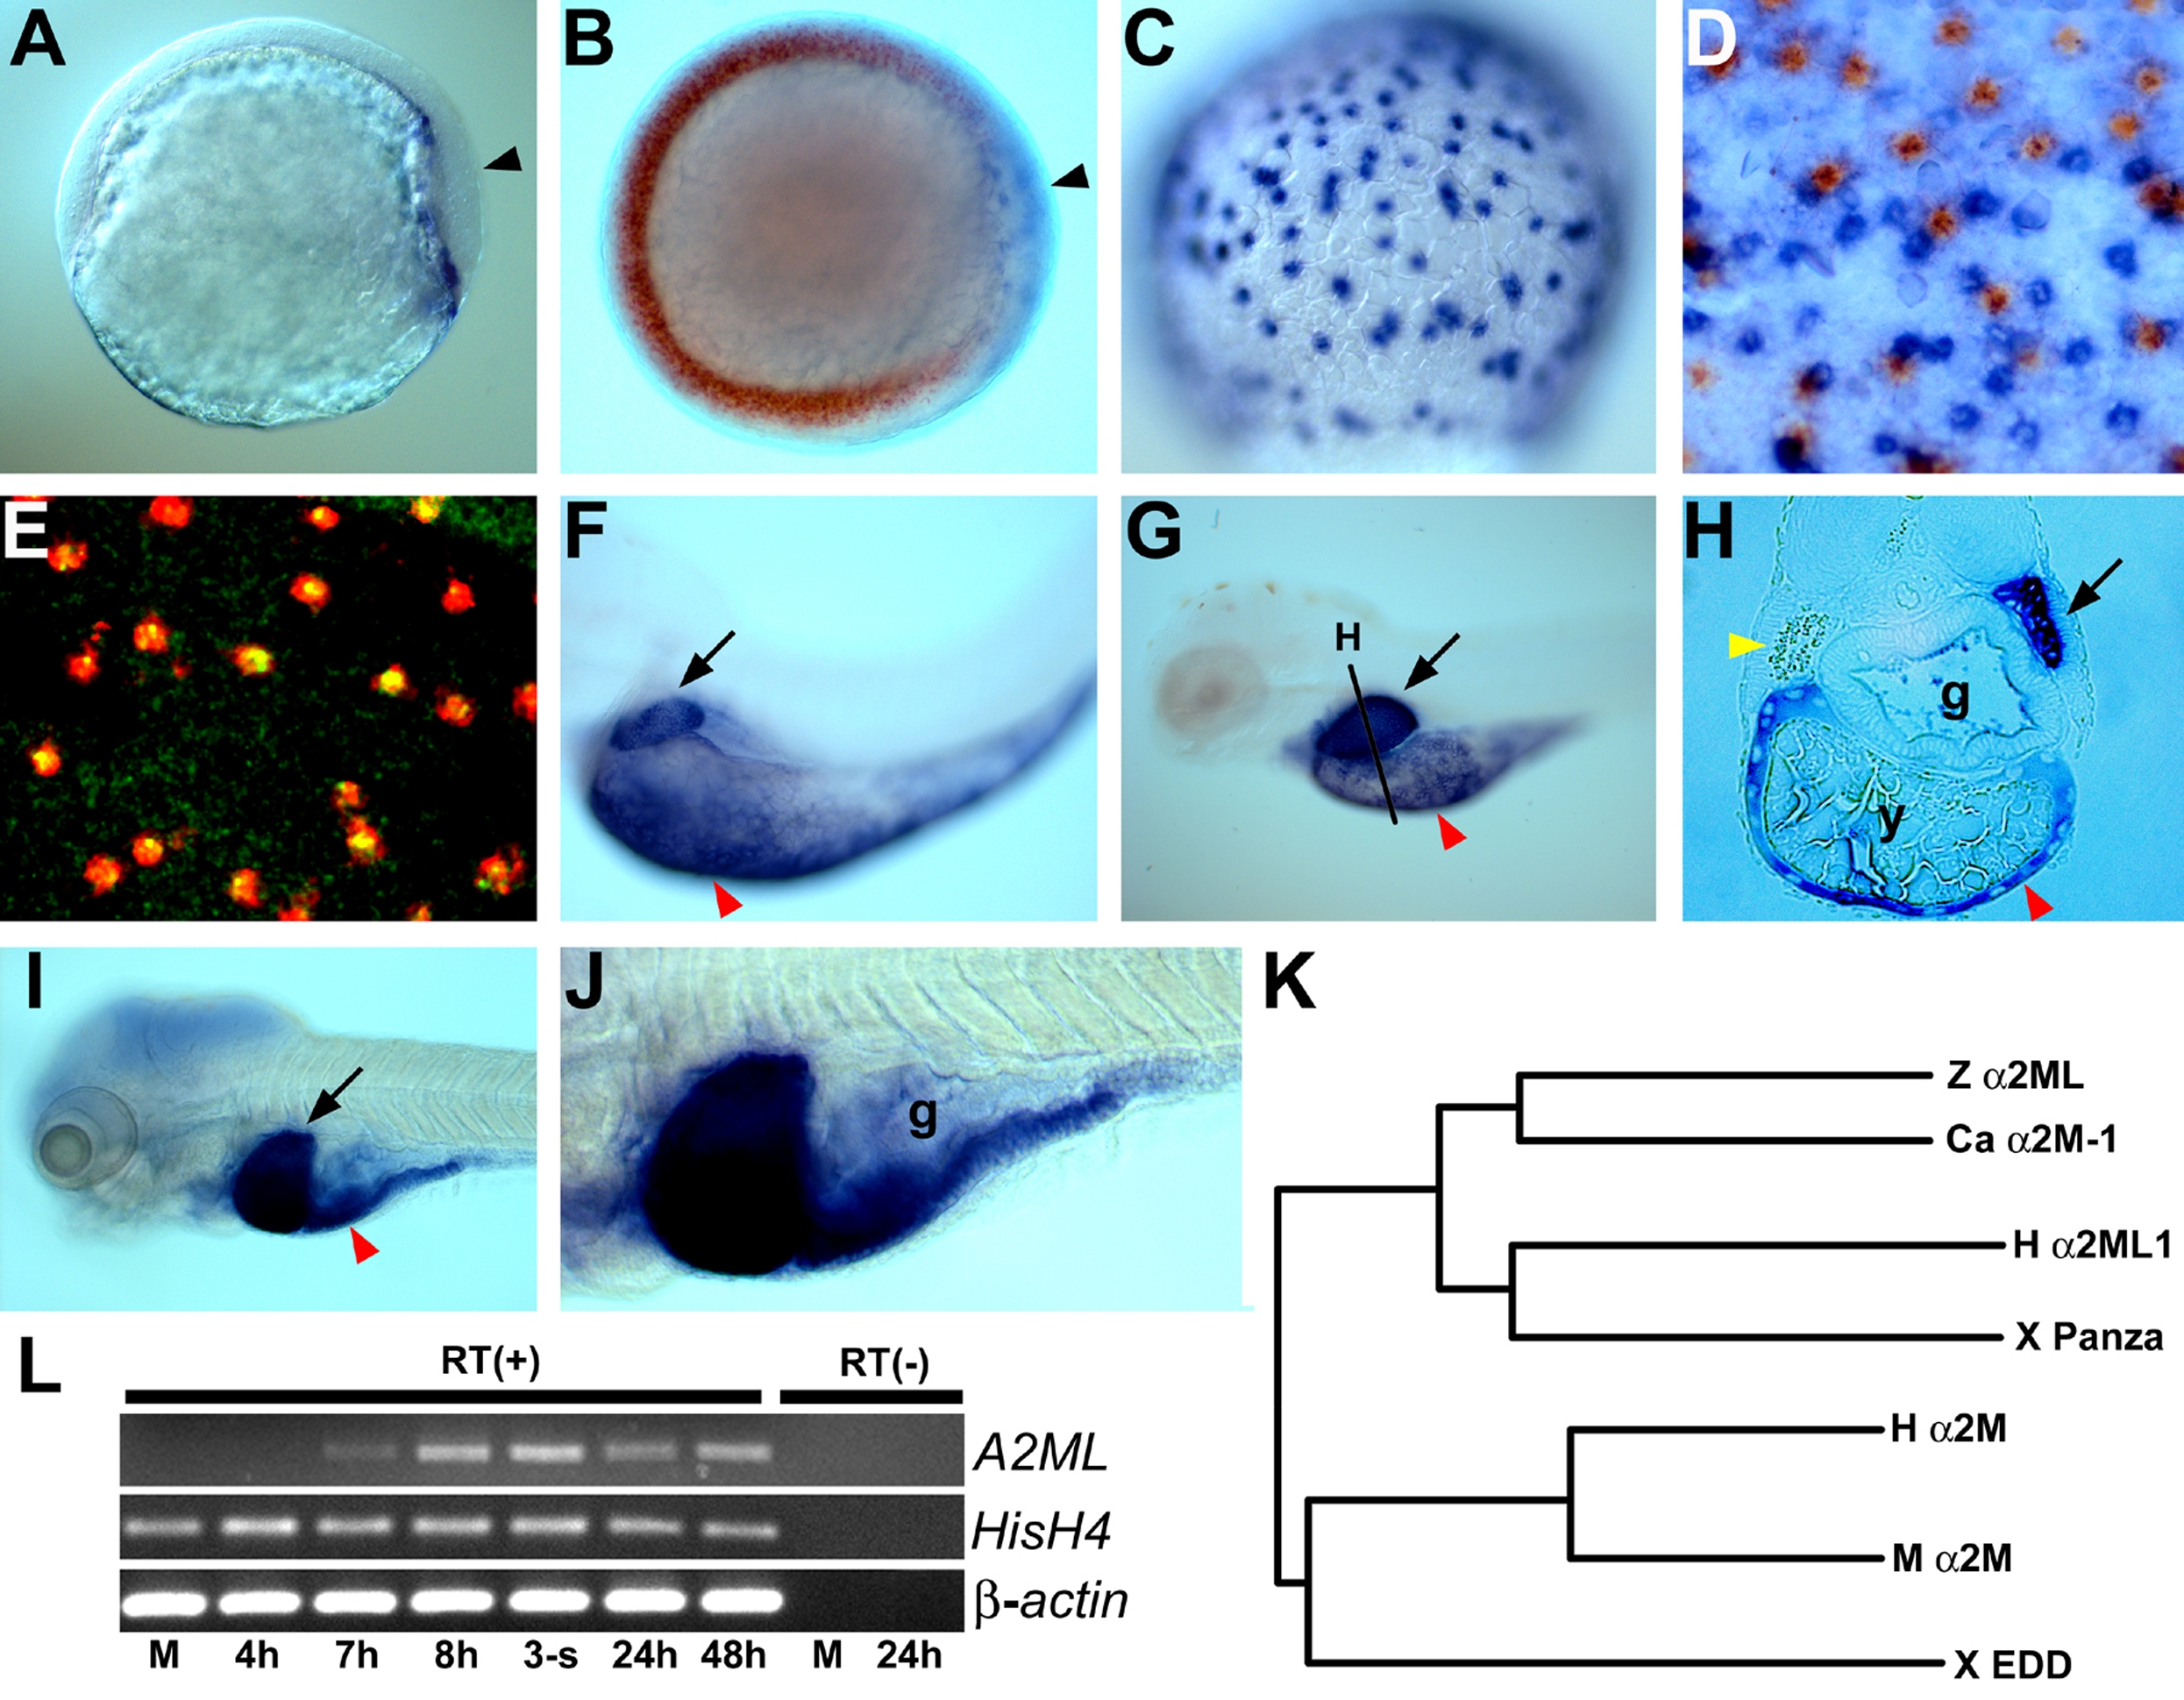
Fig. 1 Expression and phylogenic tree analysis of zebrafish A2ML.
A–B. Lateral (A) and dorsal view (B) of restricted expression of A2ML under the embryonic shield at 70% epiboly. (B) is double labeled with vent (red). Arrowheads in A and B point to the embryonic shield. C–E. 80% epiboly stage. Lateral view of A2ML expression in the nucleus of YSL cells. (D) Two color in situ hybridization with cas (blue) and A2ML (red). (E) Fluorescence in situ hybridization with tfa (green) and A2ML (red). F. Lateral view of A2ML expression in the liver at 3.5dpf. G–H. Restricted expression of A2ML in liver and yolk (G) and transverse section (H) at 4.5dpf. Yellow arrowhead points to A2ML-negative pancreas rudiment. I–J. Lateral view of A2ML expression at 7dpf. K. Phylogenic tree of A2M family. Ca, carp; H, human; M, mouse; X, Xenopus, Z, zebrafish. See Supplementary Material for accession numbers. L. RT-PCR analysis of A2ML in development; Histone H4 and β-actin were used as controls. Arrows in F–I indicate developing liver, and red arrowheads in F–I point to yolk. g, gut; y, yolk.